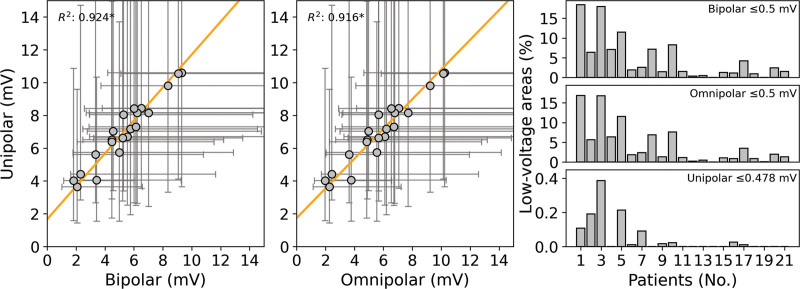
Figure 4.
Patient voltage fingerprints. Relation of the patient voltage distributions (left and center). Each dot represents the median value of the corresponding individual unipolar and bipolar voltage distribution (left) or unipolar and omnipolar voltage distributions (center). The error bars represent the 25th and 75th quartiles of each distribution. The relationship is illustrated by the orange line. Statistical significance of the relationship is indicated by an asterisk (P<0.01). The right show the amount of low-voltage areas (LVAs; top: bipolar ≤0.5 mV; middle: omnipolar ≤0.5 mV; and bottom: unipolar ≤0.478 mV) in each patient separately ranked by the median bipolar voltage.

