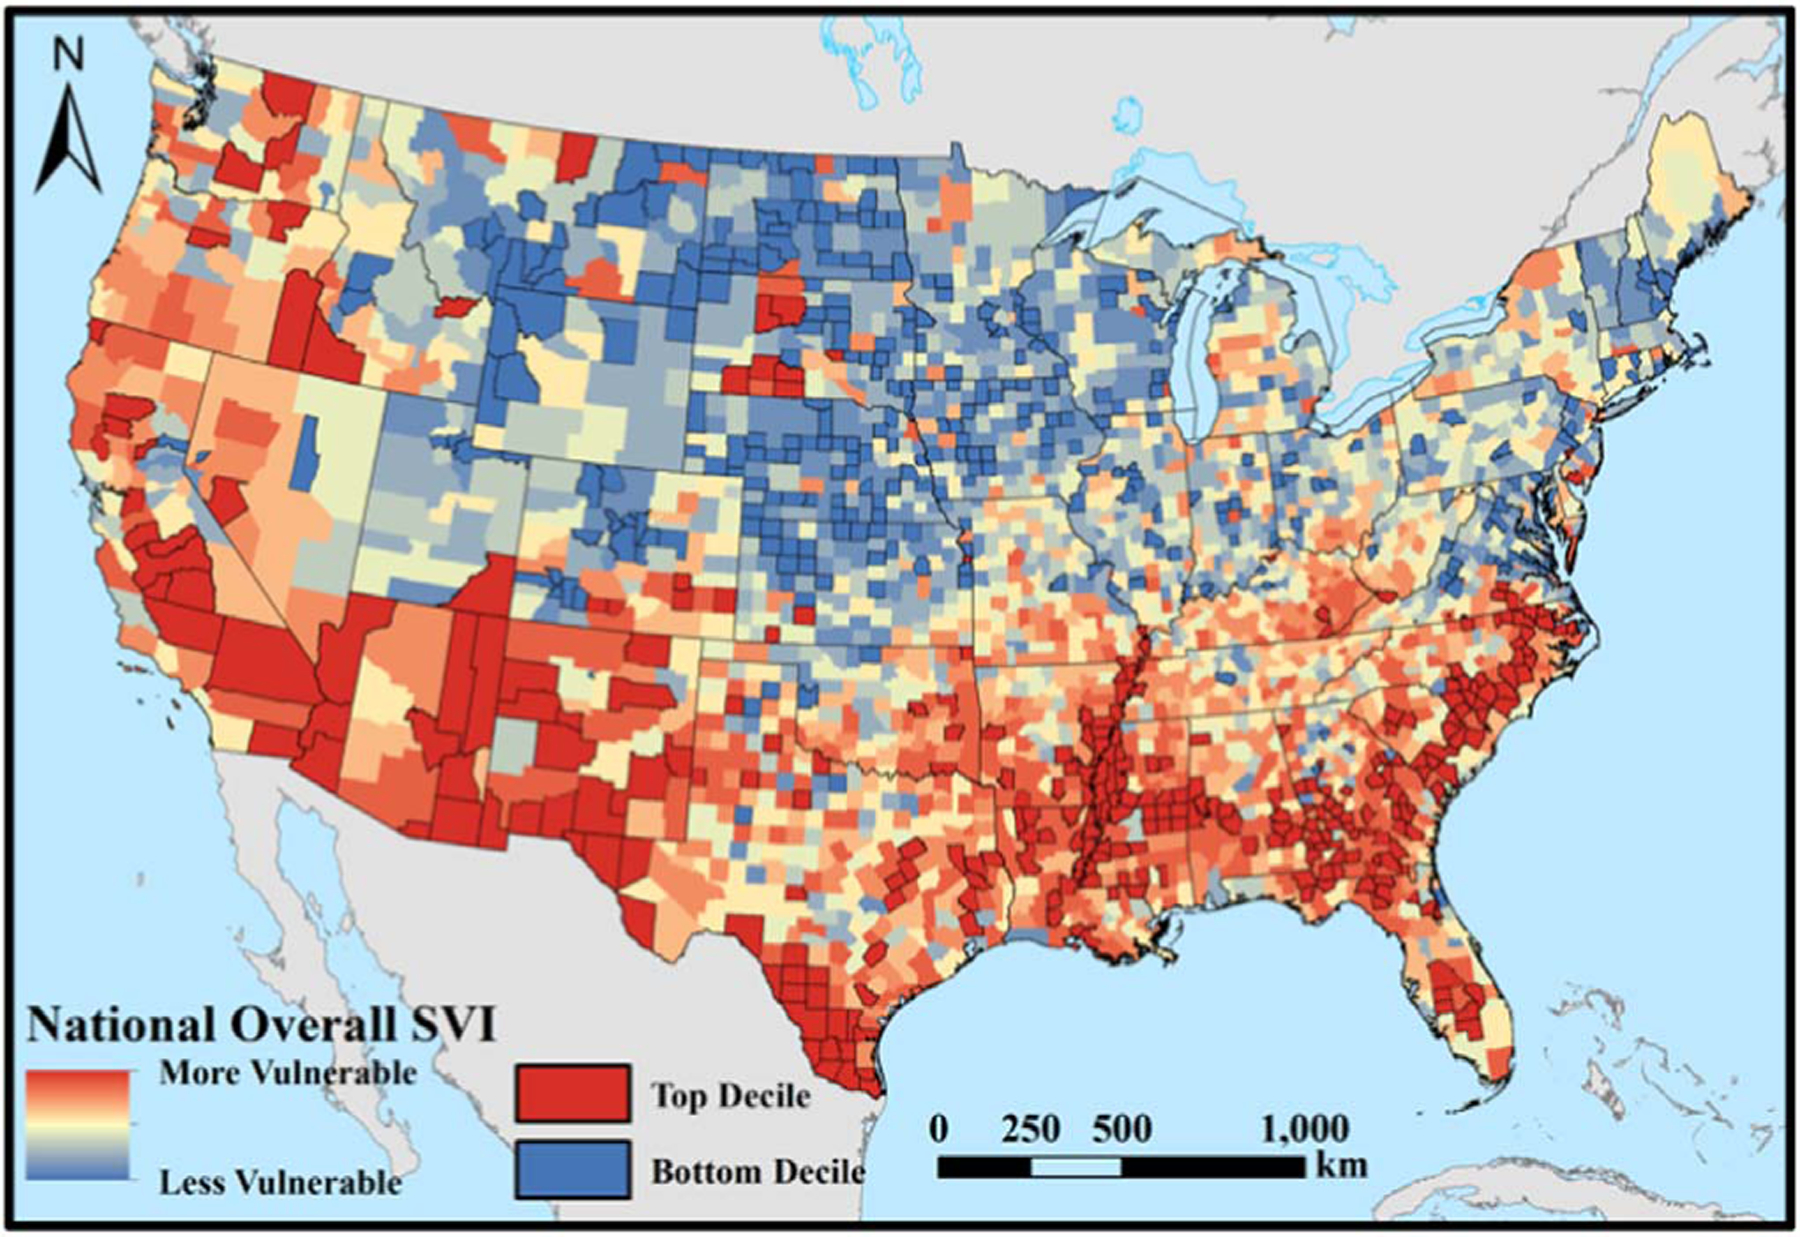
Figure 2.

Map showing the distribution of county-level overall 2016 Social Vulnerability Index (SVI) values. The top- and bottom-decile counties are outlined and in red and blue, respectively. Background mapping provided by ArcWorld and ArcWorld Supplement from Esri®.
