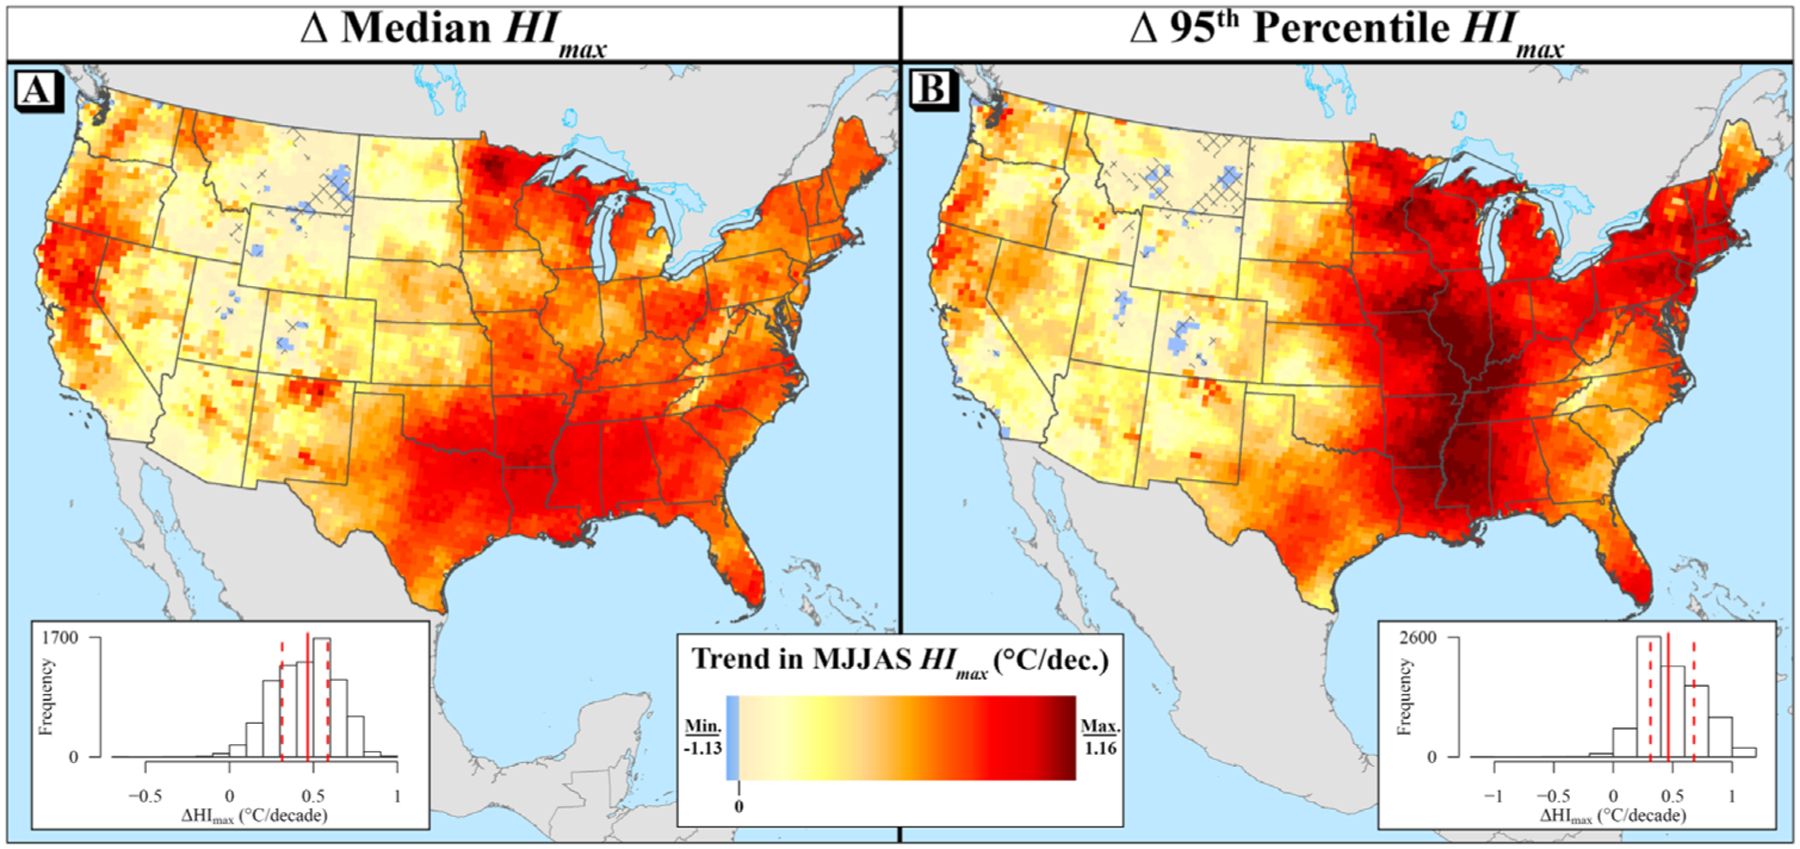
Figure 3.

Linear trends (°C/decade) in May-September (MJJAS; warm season) daily maximum heat index (HImax) for the median (a) and 95th percentile (b) for 1979–2018. Cross-hatching indicates that the trend is not statistically significant (meta-analytic p-value ≥ 0.05). Solid red lines on histograms represent the median value for the contiguous US (CONUS), while the dashed red lines indicate the first and third quartiles. Background mapping provided by ArcWorld and ArcWorld Supplement from Esri®.
