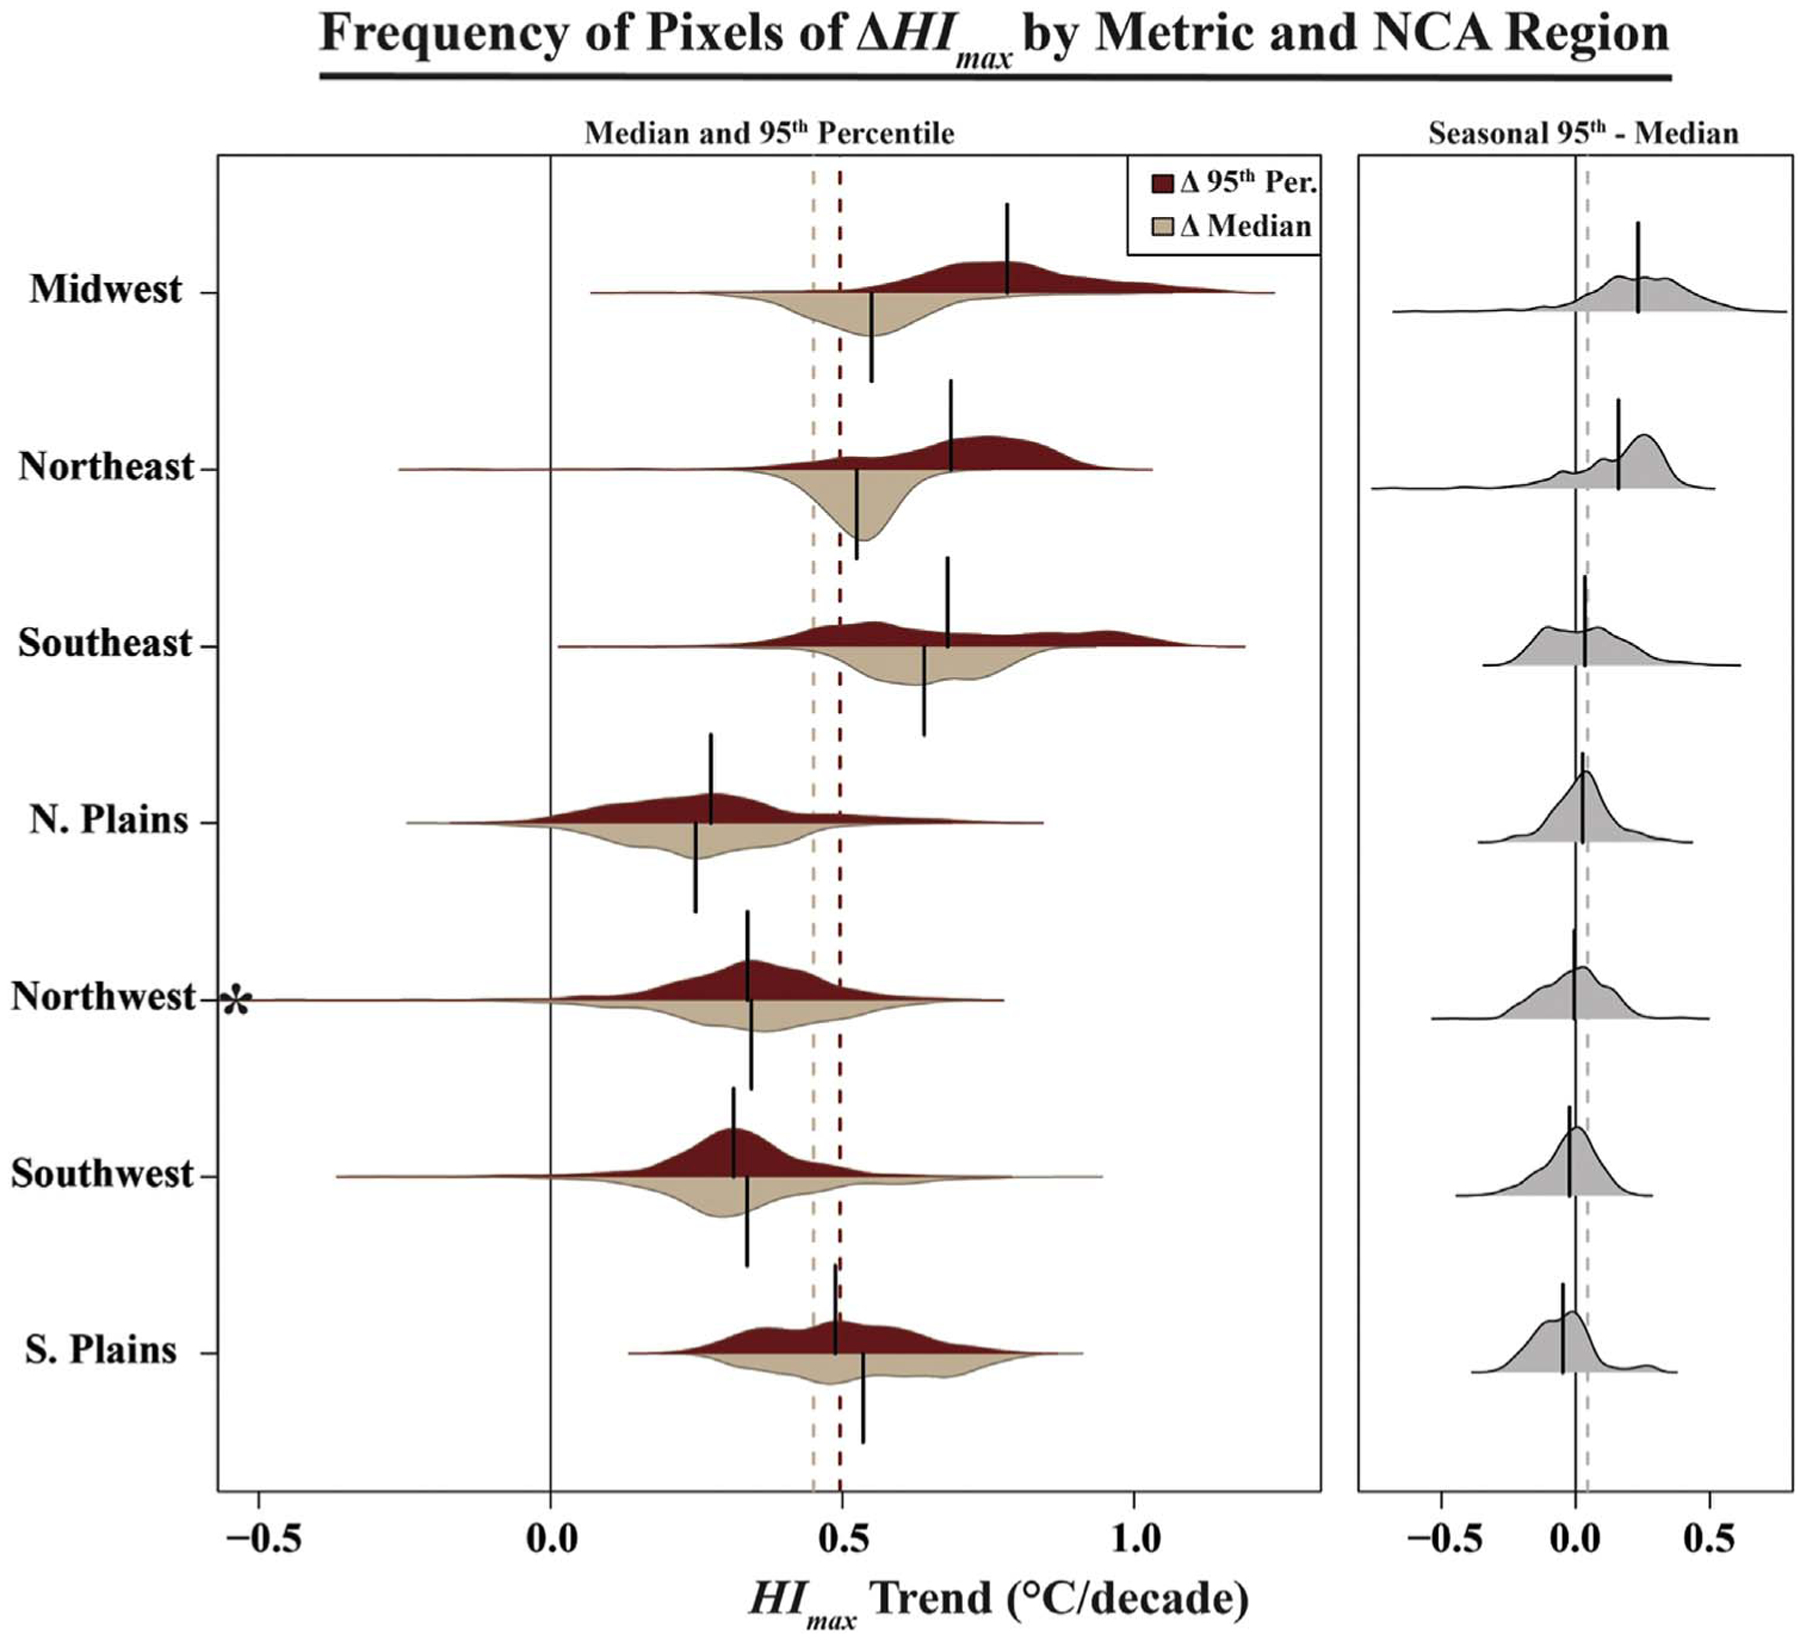
Figure 5.

Density plots showing frequency of decadal trends (1979–2018) in warm-season (MJJAS) maximum heat index (HImax) across CONUS by seasonal median and 95th percentile (left plots) and warm-tail spread (seasonal 95th percentile minus median; right plots) across the seven National Climate Assessment (NCA) regions. Solid lines on individual plots indicate mean values and dashed lines across plots indicate the CONUS average. Plots reflect frequency of NARR pixels containing at least 25% land. Asterisk (*)indicates one pixel in the Northwest that goes beyond the scale of the x-axis (values of this outlier: −0.67°C/decade [median] and −1.13°C/decade [95th percentile]).
