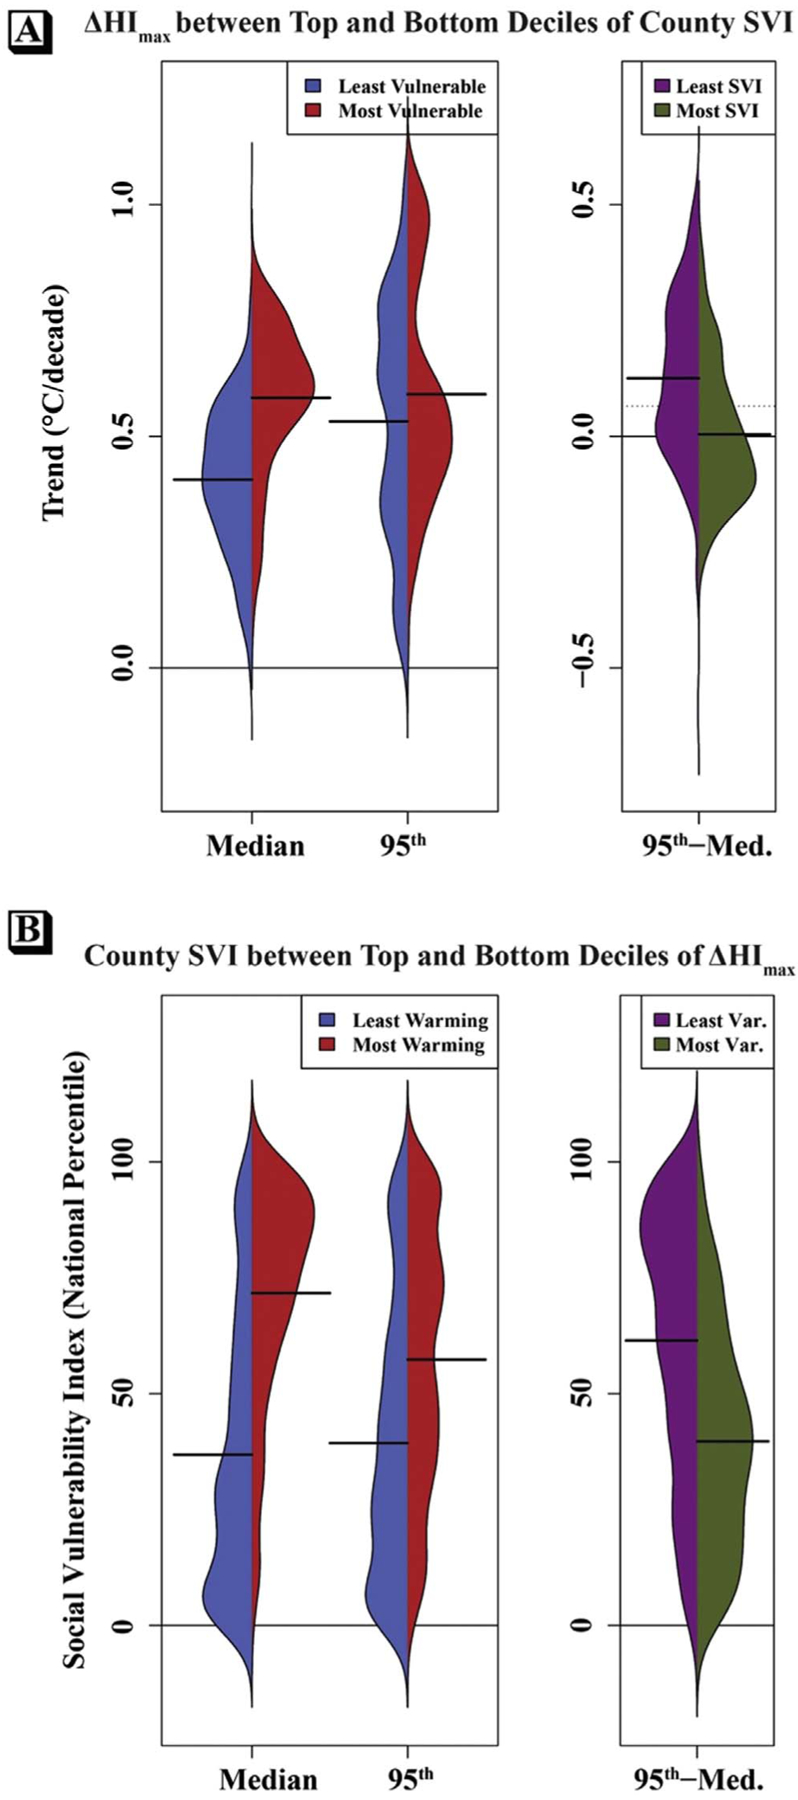
Figure 6.

Plots showing the frequency of county-level trends (1979–2018) in MJJAS median and 95th percentile of HImax (left) and in the intra-seasonal spread (95th–median, right) between the top and bottom deciles of county SVI (a), and plots showing the frequency of county-level SVI values within the top-10% fastest warming and bottom-10% slowest warming counties (b).
