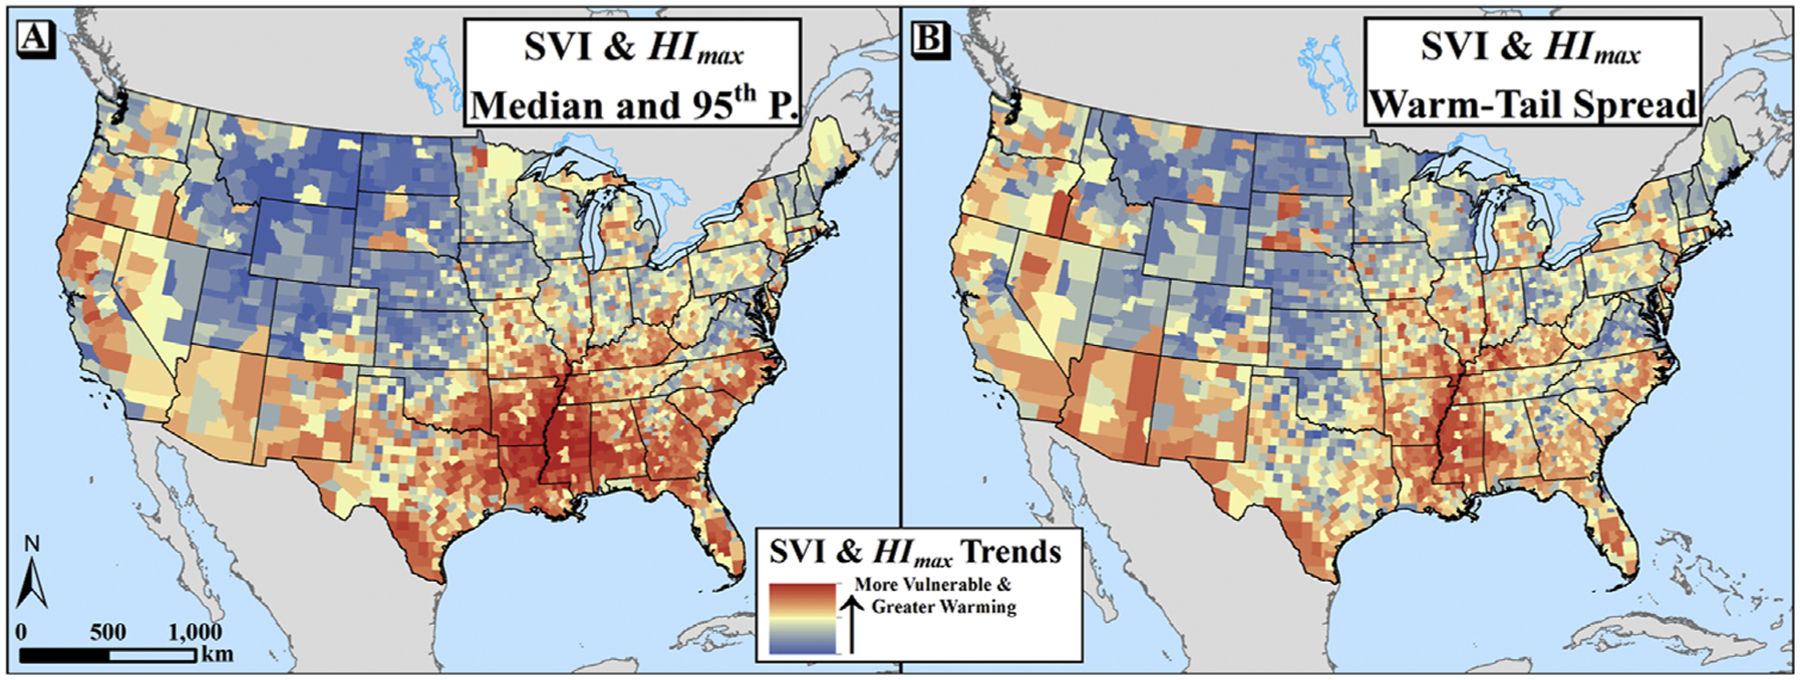
Figure 7.

Maps showing the spatial intersection of the Social Vulnerability Index and min-max standardized values of recent trends in HImax. In (a), the SVI is averaged with the mean of the standardized trends in the median and 95th percentile, while in (b) the SVI is averaged with the standardized value of the warm-tail spread (measured by the change in the seasonal 95th percentile minus median). Background mapping provided by ArcWorld and ArcWorld Supplement from Esri®.
