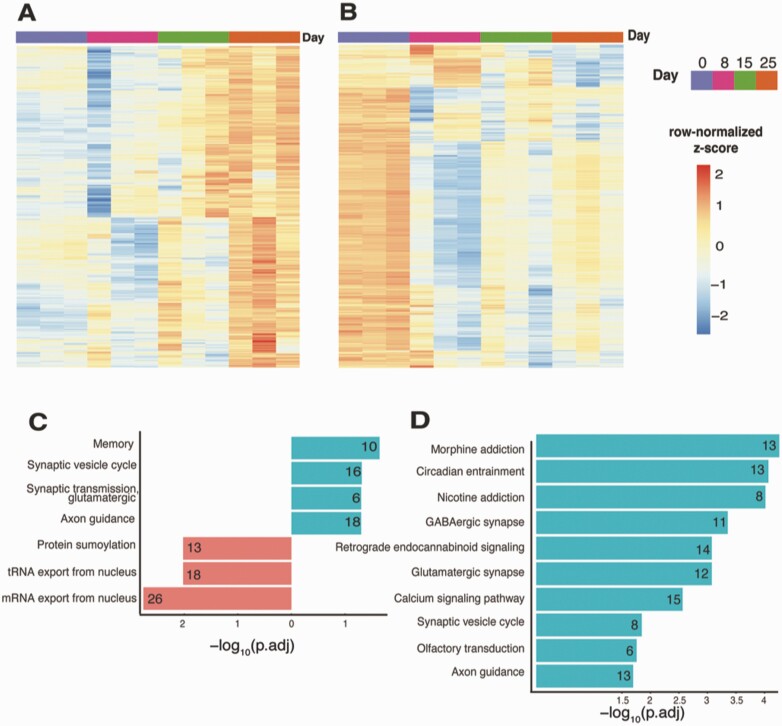
Figure 10.
Genes with expression pattern during time-course treatment with FGF8 from day 0 to day 25. (A) Gene expression patterns for 439 upregulated genes from day 0 to day 25. (B) Gene expression patterns for 1403 downregulated genes from day 0 to day 25. (C) GO enrichment terms for genes with correlated expression pattern during time-course FGF8 treatment. (D) KEGG pathway terms for genes with correlated expression pattern during time-course FGF8 treatment.

