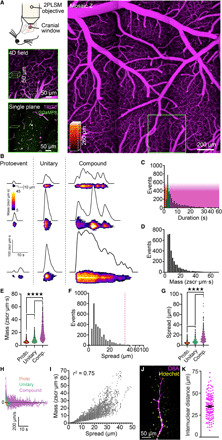
Fig. 1. Dynamic Ca2+ signaling in the brain endothelium.

(A) In vivo imaging strategy. Top left: A cranial window was centered over the somatosensory region, imaged using two-photon laser scanning microscopy. Left: Vascular field mapped from luminal TRITC-dextran. Bottom left: Region around a penetrating arteriole imaged at higher resolution, selected for 4D imaging, and a single plane, within the 4D block of interest above. Magenta, TRITC-dextran; green, GCaMP8. (B to I) Characterization of cEC Ca2+ events (proto, n = 1184 events; unitary, n = 786; compound, n = 1257). (B) Capillary Ca2+ events ranging from proto events to unitary singlets and multicomponent compound events. (C) Durations for all events analyzed. Color overlay indicates event classes: red, proto; green, unitary; magenta, compound. (D) Amplitudes for all events analyzed. (E) Event mass by class [P < 0.0001 (q3224 = 10.76), proto versus unitary; P < 0.0001 (q3224 = 43.89), unitary versus compound; P < 0.0001 (q3224 = 61.51), compound versus proto; one-way analysis of variance (ANOVA) and Tukey’s multiple comparisons test]. (F) Lengths of cEC Ca2+ events. The dashed line indicates the average length of a cEC [from (K)]. (G) Event length by class [P < 0.0001 (q3224 = 15.25), proto versus unitary; P < 0.0001 (q3224 = 34.45), unitary versus compound; P < 0.0001 (q3224 = 56.01), compound versus proto; one-way ANOVA and Tukey’s multiple comparisons test]. (H) Event spread velocity by class. Deviation above the line represents event expansion, whereas below the line represents contraction. (I) Relationship between cEC Ca2+ event mass and spread. (J) Di-8-ANEPPS (magenta) and Hoechst 33342 (yellow) staining of the capillary endothelium and cEC nuclei. (K) Internuclear distances measured using Di-8-ANEPPS and Hoechst 33342 (n = 150 measurements, 3 mice).
