
Fig. 4. Capillary Kir2.1 channel–mediated electrical signaling shapes Ca2+ signaling.
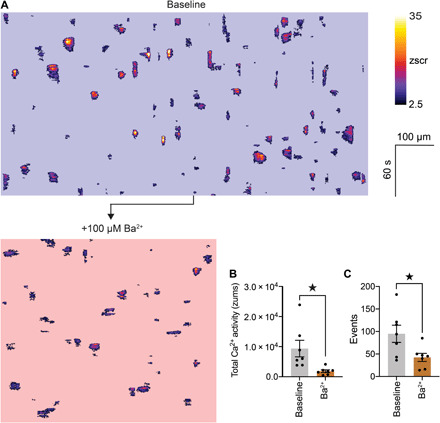
(A) ST maps extracted from the same field before and after inhibition of Kir2.1 channels with topically applied Ba2+ (100 μM). (B) Summary data showing the in vivo effects of Ba2+ on total Ca2+ activity [n = 7 experiments, 7 mice; P = 0.0353 (t6 = 2.706), paired Student’s t test] and total number of events observed (C) [n = 7 experiments, 7 mice; P = 0.0401 (t6 = 2.610), paired Student’s t test].