
Fig. 5. Ca2+ signaling tunes capillary diameter and blood flow.
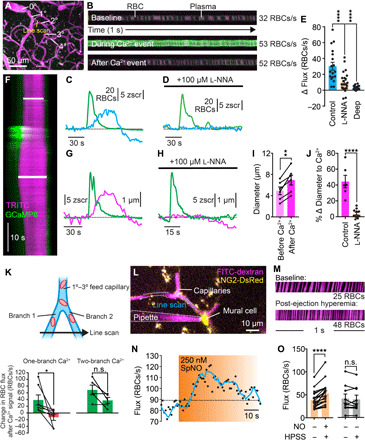
(A) Flux experiment setup. (B) Line scans showing RBCs (black) passing through a capillary in fluorescent plasma (x, time; y, space). (C) Hyperemia (blue) following a spontaneous Ca2+ signal (green). (D) l-NNA inhibition of Ca2+-associated increases in RBC flux. (E) Changes in flux after a Ca2+ event at 1° to 3° bifurcations of the capillary network with and without l-NNA and in deeper capillaries (≥5°) [n = 18 to 24 experiments, 7 to 9 mice; P = 0.0001 (q58 = 4.768) control versus l-NNA; P = 0.0001 (q58 = 5.965) control versus deep; one-way ANOVA and Dunnett’s multiple comparison test]. (F) Line scan showing capillary dilation to a Ca2+ event (y, time; upper bar, baseline; lower bar, peak). (G) Diameter (magenta) and Ca2+ (green) for the experiment in (F). (H) As in (G), an experiment following cortex perfusion with l-NNA. (I) Dilation following Ca2+ signaling [n = 6 experiments, 5 mice; P = 0.0029 (t5 = 5.438); paired t test]. (J) l-NNA inhibition of Ca2+-induced dilation [n = 6 to 11 paired experiments, 5 to 7 mice; P < 0.0001 (t15 = 6.589); unpaired t test]. (K) Directional control of blood flow by capillary Ca2+. Top: Experimental approach. Two branches, fed by a 1° to 3° capillary, were simultaneously line-scanned. Bottom: Summary showing differential blood flow when a Ca2+ signal occurred in one branch only (left) and uniform blood flow through the two segments when a signal occurred in both branches (right). [one-branch Ca2+ event: n = 7 paired experiments; P = 0.0395 (t6 = 2.621); paired t test; two-branch Ca2+ event: n = 5 paired experiments; P = 0.0837 (t4 = 2.292); paired t test]. (L) Pipette containing spermine NONOate next to a pericyte. Flux was measured by line-scanning the capillary during ejection. (M) RBCs passing through the line-scanned region against fluorescent plasma (x, time). (N) Time course of RBC flux to NO. (O) Peak RBC flux at baseline and after NO [n = 19 experiments, 8 mice; P < 0.0001 (t18 = 5.714); paired t test] or HPSS [n = 9 experiments, 5 mice; P = 0.4587 (t8 = 0.7784); paired t test].