
Fig. 3. Multiregional expression profiles of transmembrane protein–coding genes at the transcriptome and proteome levels.
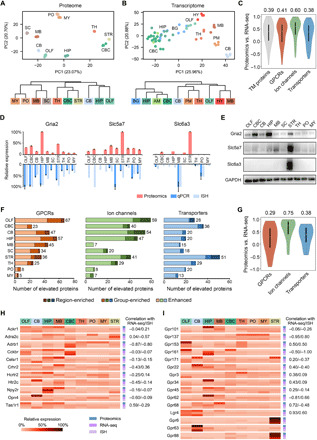
(A and B) PCA (top) and HCA (bottom) showed different patterns of regional expression of transmembrane protein–coding genes based on proteomics data (this study) (A) versus RNA-seq data (6) (B). (C) Spearman correlation of expression profiles across at least five brain regions between the proteomic and RNA-seq measurement for all transmembrane (TM) proteins and three transmembrane protein families. Median correlation coefficients are shown above the plots. (D) Examples of discordant expression profiles measured by proteomics, qPCR, and ISH. (E) Validation of regionally elevated expression of transmembrane proteins with inconsistent mRNA profiles by immunoblotting. (F) ID of regionally elevated GPCRs, ion channels, and transporters in the three categories (region-enriched, group-enriched, and enhanced). Total numbers of elevated proteins in each region are provided to the right. (G) Spearman correlation of expression profiles across at least five brain regions indicated the lowest protein-to-mRNA correlation for region/group-enriched GPCRs. Median correlation coefficients are shown above the plots. (H and I) Relative expression profiles of region/group-enriched GPCRs with negative mRNA-to-protein correlation (H) and region/group-enriched orphan receptors (I). The correlation coefficient of proteomic versus RNA-seq or proteomic versus ISH measurement is annotated for each GPCR. No correlation available for three receptors of which the expression profiles were overlapped between less than five regions.