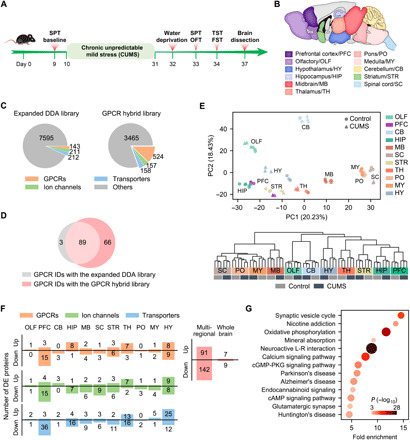
Fig. 5. Transmembrane proteome profiling of the mouse brain in the CUMS model of depression.

(A) Procedure for establishing the CUMS model. (B) Anatomically dissected brain regions of the control and CUMS mice for proteomic analysis. (C) Number of protein IDs in the expanded DDA library and the GPCR hybrid library specifically built for the CUMS model. (D) Comparison of GPCR IDs from 11 brain regions of the CUMS model with the two libraries. (E) PCA (top) and HCA (bottom) of regional expression of all detected transmembrane proteins revealed tight clustering of control and CUMS groups for most of brain regions analyzed. Notice the separation of control and CUMS groups for PFC and HY in the PCA plot. (F) Number of up- and down-regulated GPCRs, ion channels, and transporters identified in each region (left). Number of unique DE proteins from the GPCR/ion channel/transporter families identified in total by multiregional analysis and by whole brain analysis (right). (G) Significantly enriched pathways (P < 0.001) in the DE GPCRs, ion channels, and transporters identified by multiregional analysis. cGMP, guanosine 3′,5′-monophosphate; PKG, cGMP-dependent protein kinase.
