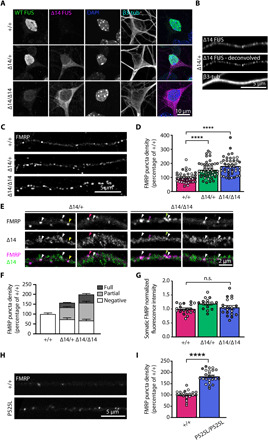
Fig. 1. FUS mutants induce increased FMRP puncta density in MN axons.

(A) Representative images of primary MNs at 5 days in vitro (DIV 5). Wild-type (WT) FUS (green), detected with a C-terminal antibody, is primarily localized in the nucleus in Fus+/+ and Fus∆14/+ neurons. ∆14 FUS (magenta) is enriched in the cytoplasm of Fus∆14/+ and Fus∆14/∆14 neurons. Nuclei are labeled with 4′,6-diamidino-2-phenylindole (DAPI) (blue), and β3-tubulin (cyan) is used as a neuronal marker. Low-intensity wild-type FUS-positive nuclear staining in Fus∆14/∆14 neurons is due to antibody cross-reactivity with another FET protein, likely EWSR1. (B) ∆14 FUS distribution in a Fus∆14/+ MN axon. ∆14 FUS signal detected by confocal microscopy (top) and the deconvoluted signal (middle). Neurons were grown in microfluidic devices, and β3-tubulin is used to identify axons. (C) Representative deconvolved images of FMRP axonal puncta in Fus+/+, Fus∆14/+, and Fus∆14/∆14 MNs grown in microfluidic chambers (MFCs) (DIV 8). (D) Quantification of axonal FMRP puncta density in Fus+/+, Fus∆14/+, and Fus∆14/∆14 MNs (n = 4, axons = 45 to 47, ****P < 0.0001; Kruskal-Wallis, followed by Dunn’s post hoc test). (E) Representative images showing axonal FMRP puncta either fully (white arrowheads) or partially (colored arrowheads) positive for ∆14 FUS in Fus∆14/+ and Fus∆14/∆14 MNs. (F) Segmentation of FMRP puncta density into fully ∆14 positive and partially ∆14 positive and negative. (G) Quantification of somatic FMRP fluorescence in Fus+/+, Fus∆14/+, and Fus∆14/∆14 HB9::GFP (green fluorescent protein)–positive MNs (n = 4, MNs = 15 to 19). (H) Representative images of FMRP axonal puncta in FUS+/+ and FUSP525L/P525L iPSC-derived MNs grown in MFCs. (I) Quantification of axonal FMRP puncta density in FUS+/+ and FUSP525L/P525L iPSC-derived MNs as shown in (F) (n = 4, axons = 21 to 24; ****P < 0.0001, Student’s t test). Independent experiments are visualized in different shades of gray in the graphs. n.s., not significant.
