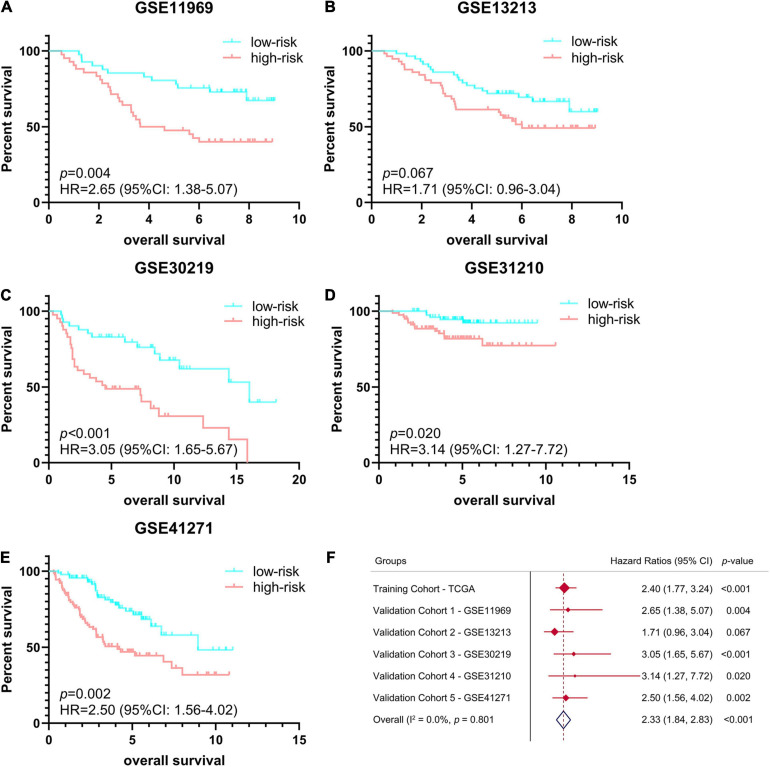
FIGURE 4.
Validation of ferroptosis-related prognostic signature in LUAD from different GEO cohorts. (A–E) Kaplan-Meier survival curves of OS in 5 independent GEO cohorts, (A) GSE11969 (n = 90), (B) GSE13213 (n = 117), (C) GSE30219 (n = 85), (D) GSE31210 (n = 158), (E) GSE41271 (n = 184). (F) Meta-analysis was performed to combine HR values obtained from TCGA and 5 GEO cohorts. GEO, Gene Expression Omnibus; HR, hazard ratio.

