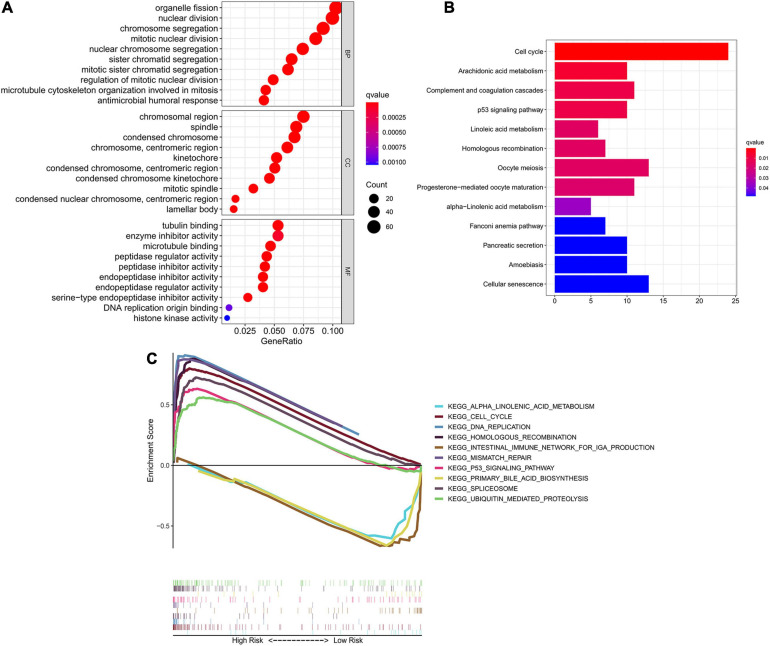
FIGURE 6.
Identification of biological pathways associated with the risk of ferroptosis. (A) GO analysis of DEGs between different risk groups into three functional groups, including BP, CC and MF. (B) KEGG analysis of DEGs between different risk groups. (C) Multiple-GSEA between the high-risk and low-risk groups of TCGA cohort. GO, Gene Ontology; BP, biological process; CC, cellular component; MF, molecular function; KEGG, Kyoto Encyclopedia of Genes and Genomes; GSEA, Gene set enrichment analysis.

