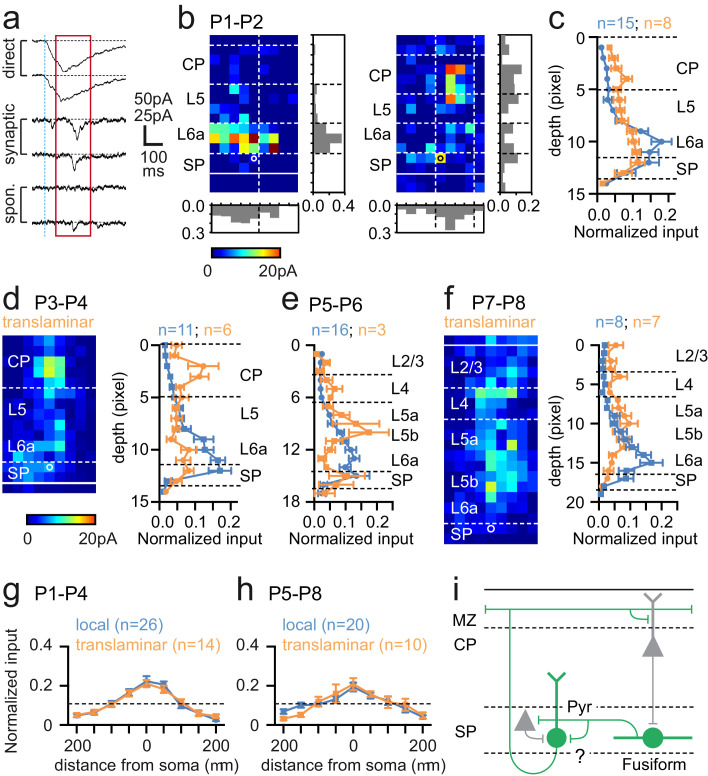
Figure 3. Synaptic integration of Lpar1-EGFP SPNs into the local cortical glutamatergic network.
(a) LSPS of caged glutamate resulted in three responses observed in whole cell patch-clamp recordings of SPNs: top traces, large amplitude direct responses with onset locked to laser pulse onset (dashed vertical blue line); middle traces, synaptic response of consistent excitatory postsynaptic currents (EPSCs) within the monosynaptic event window (red box); bottom traces, no consistent response with occasional spontaneous EPSCs. Scale bar for direct traces: 50 pA; for synaptic and spontaneous: 25 pA. (b) Local (left) and translaminar (right) glutamatergic input maps for SPNs recorded at P1-2. Pixel size: 50 µm. (c) Average input profile for local (blue) and translaminar (orange) SPNs; translaminar SPNs showed increased input from the cortical plate (CP) and reduced local (L6a/SP) innervation. (d) Left panel, average input map for translaminar SPNs recorded at P3–4 (n=6); right panel, average input profile for local (blue) and translaminar (orange) SPNs. (e) Corresponding input profile for P5–6. (f) Average input map and profile for SPNs recorded between P7 and P8. Horizontal profile for local and translaminar SPNs aligned on cell soma at (g) P1-P4 and (h) P5–8. Horizontal axis indicates the lateral distance from the soma. (i) Schematic showing glutamatergic circuit onto Lpar1-EGFP SPNs.

