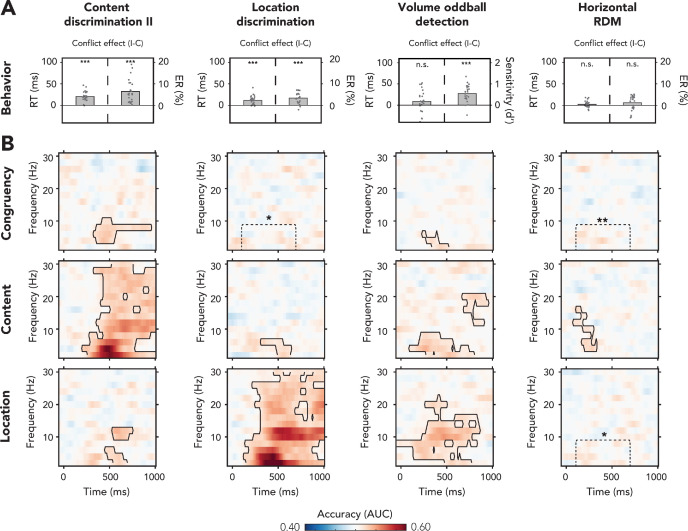
Figure 4. Behavioral and multivariate decoding results for experiment 2.
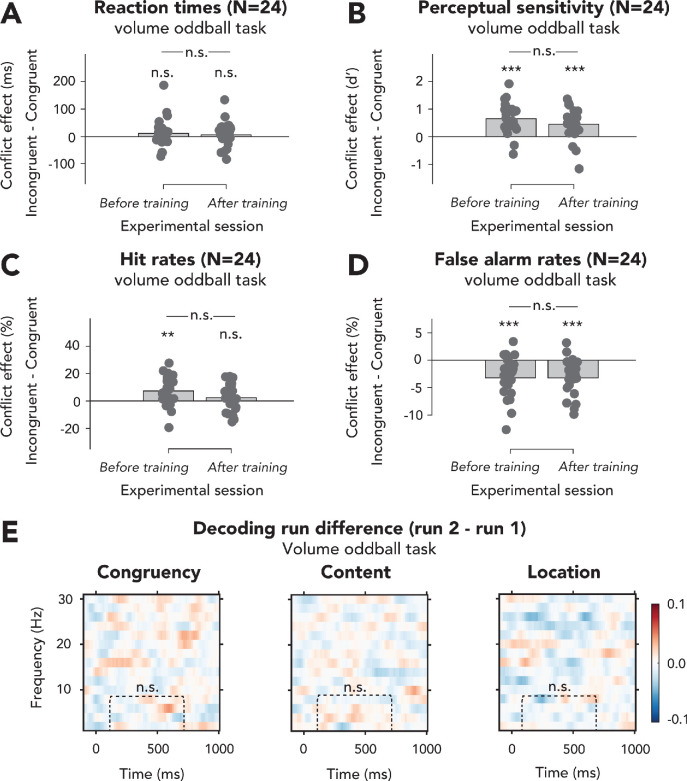
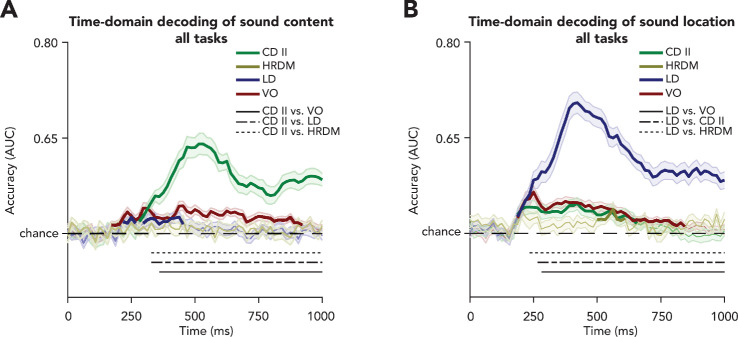
(A, B) The four columns show data belonging to, from left to right, content discrimination task II, the location discrimination task, the volume oddball detection task, and the horizontal random dot-motion (RDM) task. (A) Behavioral results are plotted as conflict effects (incongruent – congruent). Effects of conflict were present in all tasks where the auditory stimulus was task-relevant (content discrimination task II, location discrimination task, and volume oddball). In both auditory discrimination tasks, we observed longer reaction times (RTs) (left bar) and increased error rates (right bar) for incongruent compared to congruent trials. For the volume oddball, we did not observe an effect in RT, but increased sensitivity (d’) on incongruent compared to congruent trials. Dots represent individual participants. The data that is shown here can be found in Figure 4—source data 1. (B) Multivariate classifier accuracies for different stimulus features (auditory congruency, auditory content, and auditory location). Classifier accuracies (area under the curve [AUC]) are plotted across a time-frequency window of −100 ms to 1000 ms and 2–30 Hz. Classifier accuracies are thresholded (cluster-based corrected, one-sided: >0.5, p<0.05), and significant clusters are outlined with a solid black line. The dotted box shows the predefined ROI on which we performed a hypothesis-driven analysis. Note that the data shown for the volume oddball task was merged over both runs. *p<0.05, **p<0.01, ***p<0.001; n.s.: p>0.05.


