. 2021 Jun 30;10:e65215. doi: 10.7554/eLife.65215

Figure 1. Cell-type specific removal of Miro1 from parvalbumin interneurons impairs mitochondrial trafficking.

(A) COX-IV levels in PV+ interneurons. The fluorescence signal of COX-IV is increased in PV immuno-positive cells in the hippocampus. Scale bar = 10 μm. Boxplot and cumulative distribution show the quantification of the mean integrated intensity of the COX-IV fluorescent signal in PV immuno-positive and -negative regions (n = 81 cells, 11 slices, three animals). (B) Miro1-directed mitochondrial trafficking in organotypic brain slices. Representative images from a 500 s two-photon movie of MitoDendra+ mitochondria in PV+ interneurons in ex vivo organotypic hippocampal slices from WT, ΗΕT, and Miro1 KO animals. The colored numbers/lines denote tracks of individual mobile mitochondria during the movie. Scale bar = 10 μm. The kymographs represent the mitochondrial displacement over time. Scale bar = 5 μm. (C) Quantification of the percentage of moving mitochondria (nWT = 15 movies, nine slices, four animals, nΗΕT = 32 movies, 10 slices, four animals, nKO = 22 movies, eight slices, four animals). (D) Quantification of the median velocity (nWT = 35 mitochondria, nΗΕT = 65 mitochondria, nKO = 22 mitochondria). (E) Quantification of the distance traveled (nWT = 31 mitochondria, nΗΕT = 66 mitochondria, nKO = 22 mitochondria).

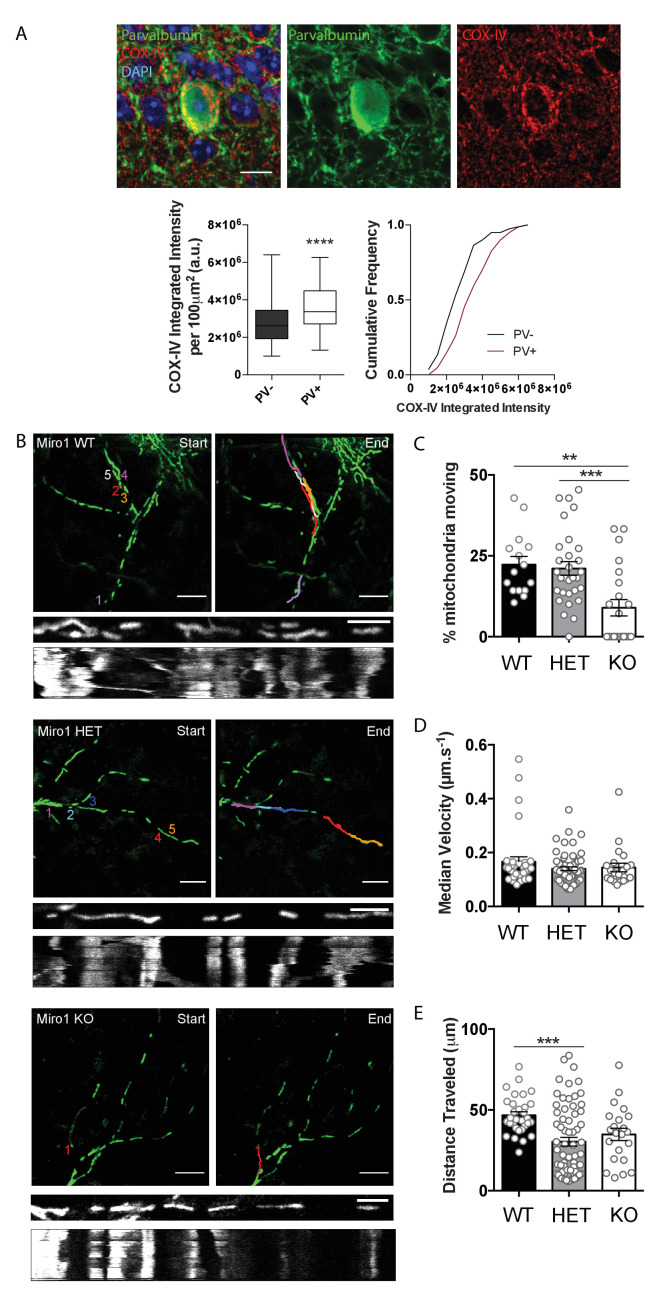
Figure 1—source data 1. Source data for COX-IV levels and mitochondrial trafficking in PV+ interneurons.

Figure 1.

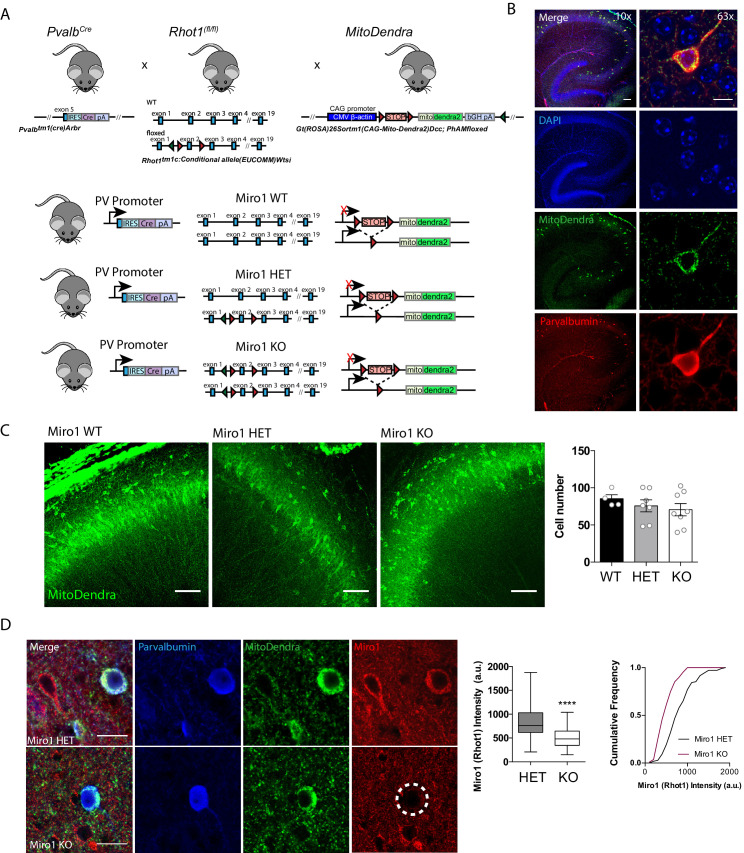
Figure 1—figure supplement 1. Generation of the PvalbCre Rhot1flox/flox MitoDendra transgenic mouse line and conditional removal of Miro1 from MitoDendra-expressing parvalbumin interneurons.

Figure 1—figure supplement 1.

(A) Schematic diagram of the genetic recombination for the expression of MitoDendra and simultaneous conditional removal of Miro1. When the Cre recombinase is expressed, under the PV+ promoter, the stop-floxed codon in the Rosa26 locus is excised allowing for the downstream expression of MitoDendra. Additionally, the second exon of the Rhot1 gene is found between two loxP sites and therefore removed selectively in PV+ interneurons. (B) Cell-type specific expression of MitoDendra in PV+ interneurons. Left: Representative low magnification (10×) confocal image demonstrating the PV+ interneuron distribution in the acute brain slices of the hippocampus in the PvalbCre MitoDendra mouse. Scale bar = 100 μm. Right: Representative high-magnification (63×) image of a MitoDendra-expressing cell that is also PV immuno-positive. Scale bar = 10 μm. (C) Loss of Miro1 does not affect the viability of MitoDendra-expressing parvalbumin interneurons. Max-projected confocal images from the CA3 area of the hippocampus of WT, ΗΕT and Miro1 KO animals. Scale bar = 100 μm. The bar chart shows the number of MitoDendra+ cells (nWT = 4 slices from two animals, nΗΕT = 7 slices from four animals, nKO = 8 slices from four animals). (D) Loss of Miro1 from PV+ expressing interneurons. Representative confocal image from hemi-floxed (ΗΕT) and conditional knock-out (Miro1 KO) animals. Scale bar = 10 μm. The fluorescent signal for Miro1 is specifically reduced in PV immuno-positive cells (white dotted circle shows the PV immuno-positive cell with low Miro1 fluorescence). The boxplot and cumulative frequency distribution of the Rhot1 (Miro1) fluorescent intensity signal (nΗΕT = 109 neurons, four slices, two animals, nKO = 108 neurons, four slices, two animals).
Figure 1—figure supplement 1—source data 1. Source data for cell viability and Miro1 levels.