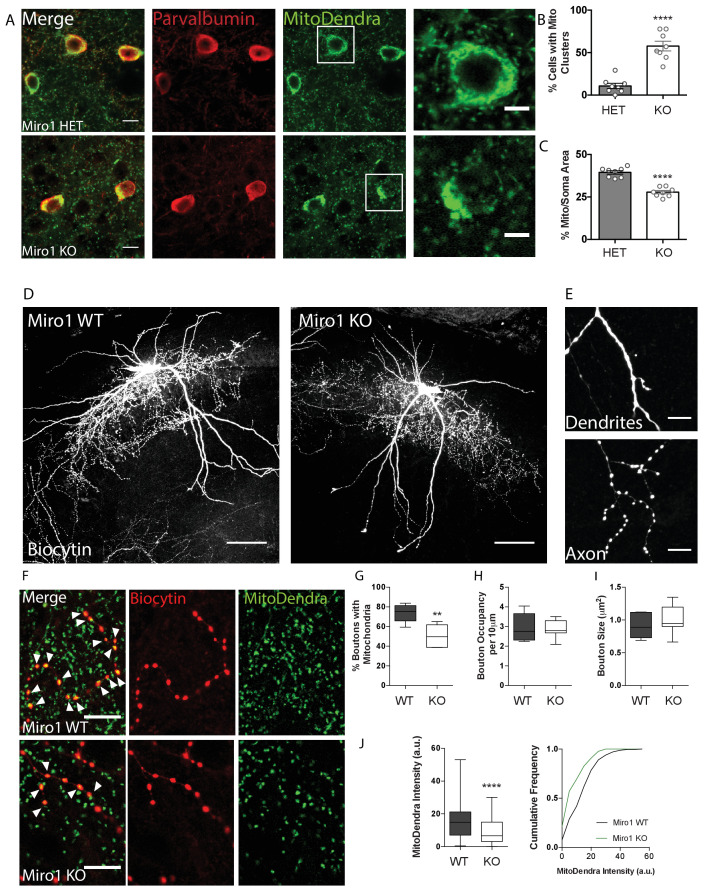
Figure 2. Loss of Miro1 results in an accumulation of mitochondria in the soma and depletion from axonal presynaptic terminals.
(A) Loss of Miro1 results in MitoDendra+ clustering in the somata of PV+ interneurons. Confocal images from ΗΕT and Miro1 KO PV immuno-positive cells in fixed brain tissue. Scale bar = 10 μm. Cells in the white box are zoomed as illustrated in the images on the right, to clearly depict the mitochondrial clusters in the Miro1 KO cells. Scale bar = 5 μm. (B) Bar chart shows the quantification for the percentage of cells that contain mitochondrial clusters (nΗΕT = eight slices, three animals and nKO = eight slices, three animals). (C) Quantification for the percentage area that mitochondria occupy within the PV immuno-positive soma. Due to the presence of mitochondrial clusters the %Mito/Soma area is significantly decreased in the Miro1 KO neurons (nΗΕT = eight slices, three animals and nKO = eight slices, three animals). (D) Representative max-projected confocal stack of biocytin-filled PV+ interneurons in the hippocampus of 350 μm fixed acute brain slices. Scale bar = 100 μm. (E) Example of the distinct distribution of biocytin in dendritic and axonal compartments. Biocytin is diffused in dendrites (top) and clustered in axonal terminals (bottom). (F) Loss of Miro1 depletes mitochondria from axonal presynaptic terminals. Representative images of biocytin-filled synaptic boutons (red) and mitochondria (green) in WT and Miro1 KO neurons. Arrows point to boutons that contain mitochondria. Scale bar = 5 μm. (G) Boxplots for the quantification of the percentage of boutons that contain mitochondria (nWT = five neurons, four slices, two animals and nKO = seven neurons, six slices, three animals). (H) Boxplots for the quantification of the occupancy of boutons in axonal segments (nWT = five neurons, four slices, two animals and nKO = seven neurons, six slices, three animals). (I) Quantification of the mean size of boutons (nWT = 625 boutons, five neurons, four slices, two animals, nKO = 526 boutons, seven neurons, six slices, three animals). (J) Boxplot and cumulative distribution for the quantification of the mean MitoDendra fluorescent intensity within biocytin-filled puncta (nWT = 246 boutons, nKO = 173 boutons).

