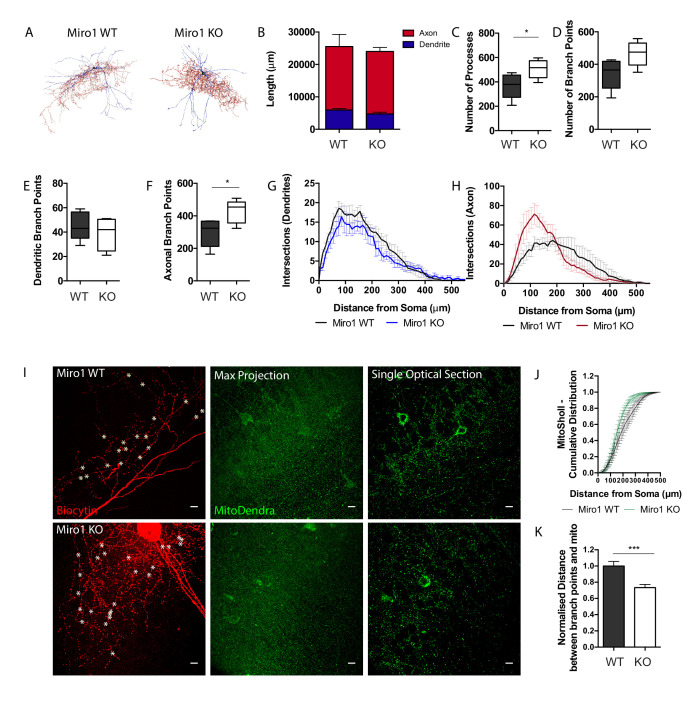
Figure 3. Loss of Miro1 results in increased axonal branching in hippocampal parvalbumin interneurons.
(A) Max-projected reconstruction of the neurons in Figure 2D from Neuromantic software. Dendrites are depicted in blue and axons in red. (B) Quantification of the neuronal length with the dendritic and axonal contribution depicted in blue and red respectively. (C) Boxplot for the quantification of the total number of processes. (D) Boxplot for the quantification of the total number of branch points. (E) Box plot for the quantification of the number of dendritic branch points. (F) Box plot for the quantification of the number of axonal branch points. (G) Number of intersections between dendritic branches and Sholl rings are plotted at distances away from the soma. (H) Number of intersections between axonal branches and Sholl rings are plotted at distances away from the soma. (nWT = five neurons, three slices, two animals, nKO = five neurons, four slices, three animals). (I) Loss of Miro1 results in mitochondria being found closer to points of axonal branching. High-magnification (63×) max-projected confocal stacks of biocytin in a 350 μm hippocampal slice. Analysis was performed in 3D in single optical sections. White stars denote branch points. Scale bar = 10 μm. (J) Cumulative distribution of the MitoDendra+ mitochondrial network (MitoSholl) in individual PV+ interneurons (nWT = five neurons, three slices, two animals, nKO = four neurons, four slices, three animals). (K) Bar graph shows the normalized minimum distance between a branch point and a mitochondrion in the confocal stack (nWT = 122 branch points, five neurons, four slices, two animals and nKO = 171 branch points, seven neurons, six slices, three animals).

