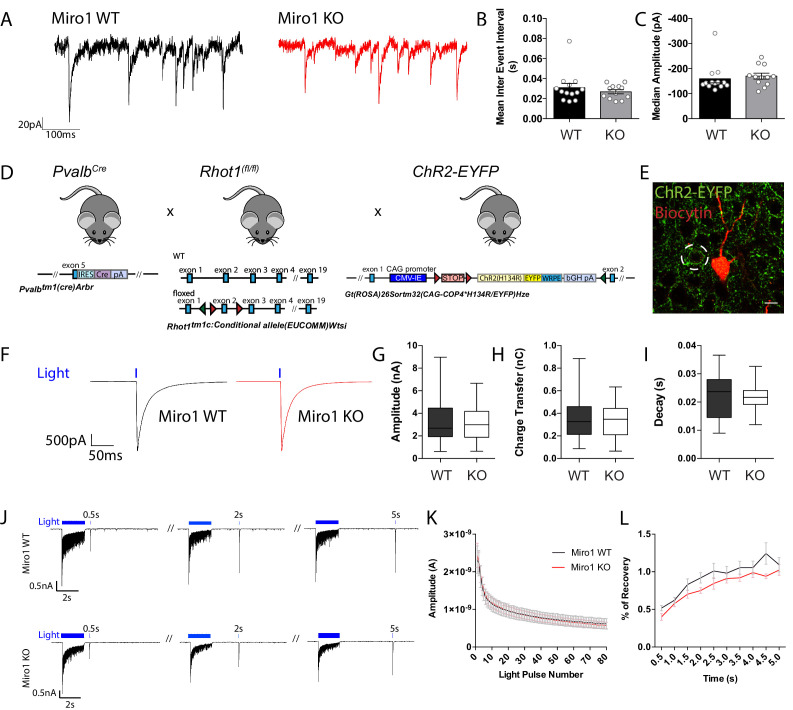
Figure 4. Miro1 knock-out does not alter spontaneous and evoked inhibitory synaptic transmission in the hippocampus.
(A) Representative electrophysiological traces of spontaneous inhibitory post-synaptic currents from WT (black) and Miro1 KO (red) cells in the hippocampus. (B) Quantification for the mean inter event interval (IEI). (C) Quantification for the median sIPSC amplitude. (nWT = 13 recordings, two animals and nKO = 12 recordings, two animals). (D) Generation of the PvalbCre Rhot1 ChR2-EYFP transgenic mouse line. Schematic diagram of the expression of ChR2-EYFP and simultaneous conditional removal of Rhot1. When the Cre recombinase is expressed, under the PV+ promoter, the stop-floxed codon is excised from the Rosa26 locus allowing the downstream expression of ChR2-EYFP. Additionally, the second exon of the Rhot1 gene is found between two loxP sites and also removed selectively in PV+ interneurons. (E) Example of confocal image from a biocytin-filled recorded pyramidal cell in the hippocampus (red) in close proximity to an EYFP+ PV+ interneuron (green). Scale bar = 10 μm. (F) Representative traces from light evoked inhibitory postsynaptic current (eIPSC) in WT (black) and Miro1 KO (red) cells in acute brain slices (nWT = 23 recordings, four animals and nKO = 23 recordings, four animals). (G) Boxplot for the quantification of peak amplitude. (H) Boxplot for the quantification of charge transfer. (I) Boxplot for the quantification of decay. (J) Control and conditional knock-out cells can sustain inhibition and recover with similar rates after long-lasting photostimulation. Example traces from the inhibitory responses pyramidal cells received in WT and Miro1 KO slices during light train stimulation (40 Hz for 2 s; 1 ms pulse width). (K) Mean amplitude of each peak during the light train stimulation (nWT = 21 recordings, four animals and nKO = 24 recordings, four animals). (L) Quantification of the percentage recovery after light stimulation of all cells at increasing time intervals from the end of the light train (nWT = 21 recordings, four animals and nKO = 18 recordings, three animals).


