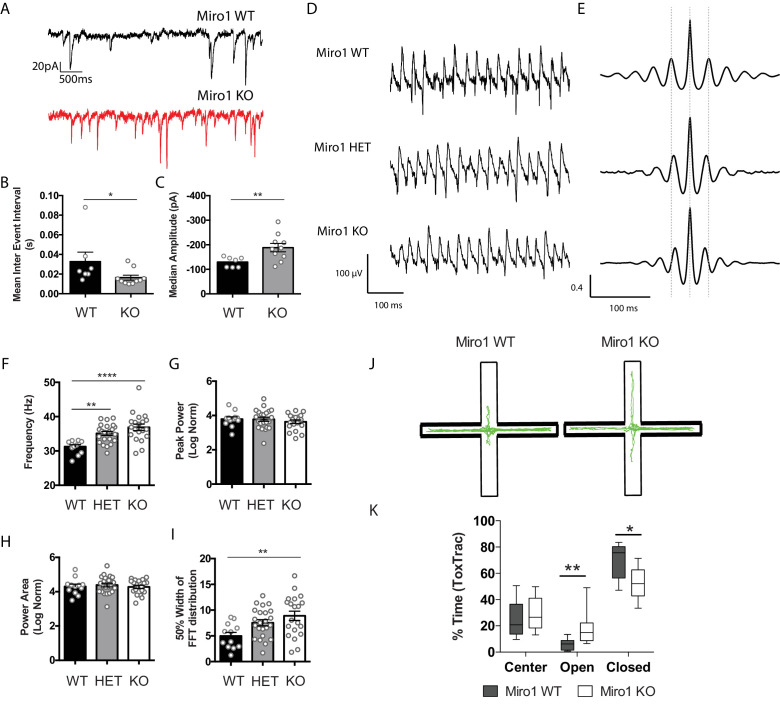
Figure 5. Miro1 knock-out results in altered hippocampal network activity and anxiety-related behavior.
(A) Miro1 KO PV+ interneurons received increased glutamateric input. Representative electrophysiological traces from WT (black) and Miro1 KO (red) cells. (B) Quantification for the mean inter event interval (IEI). (C) Quantification for the median amplitude (nWT = seven recordings, two animals and nKO = 10 recordings, two animals). (D) Loss of Miro1 increases the frequency of γ-oscillations. Representative local field potential recordings from the stratum pyramidale of the CA3 hippocampal area in acute brain slices from WT, ΗΕT, and Miro1 KO mice. (E) Representative auto-correlogram of γ-oscillations from WT, ΗΕT, and Miro1 KO animals. (F) Quantification of the peak frequency. (G) Quantification of the normalized peak power. (H) Quantification of the normalized power area. (I) Quantification of the 50% width dispersion of the FFT distribution (nWT = 12 slices, two animals, nΗΕT = 23 slices, six animals, and nKO = 20 slices, six animals). (J) Assessment of anxiety-related behavior using the elevated plus maze (EPM). Schematic diagram of the EPM and representative ToxTrac trajectories (green) from WT and Miro1 KO animals. (K) Boxplot for the quantification of the percentage of time that WT and Miro1 KO animals spent in the closed, open arms and center of the EPM (nWT = nine animals, nKO = eight animals).


