. 2021 Jul 1;10:e66175. doi: 10.7554/eLife.66175

Figure 1. The maze environment.

Top (A) and side (B) views of a home cage, connected via an entry tunnel to an enclosed labyrinth. The animal’s actions in the maze are recorded via video from below using infrared illumination. (C) The maze is structured as a binary tree with 63 branch points (in levels numbered 0,…,5) and 64 end nodes. One end node has a water port that dispenses a drop when it gets poked. Blue line in A and C: path from maze entry to water port. (D) A mouse considering the options at the maze’s central intersection. Colored keypoints are tracked by DeepLabCut: nose, mid body, tail base, four feet.

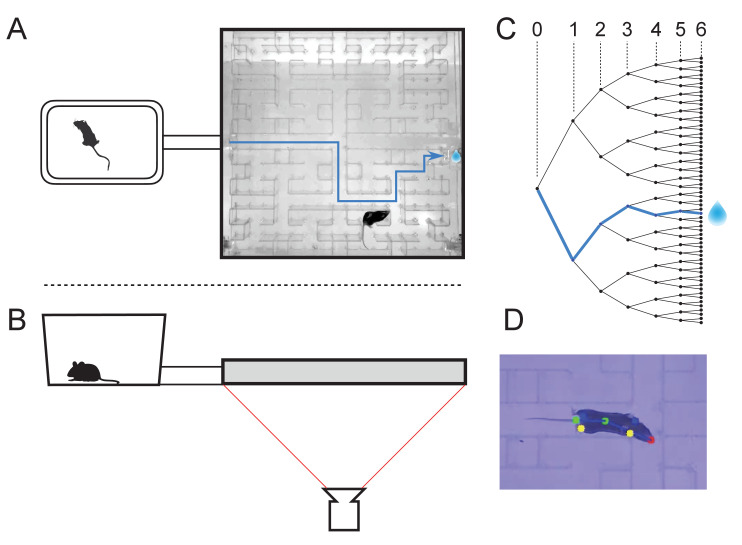
Figure 1.

Figure 1—figure supplement 1. Occupancy of the maze.

Figure 1—figure supplement 1.

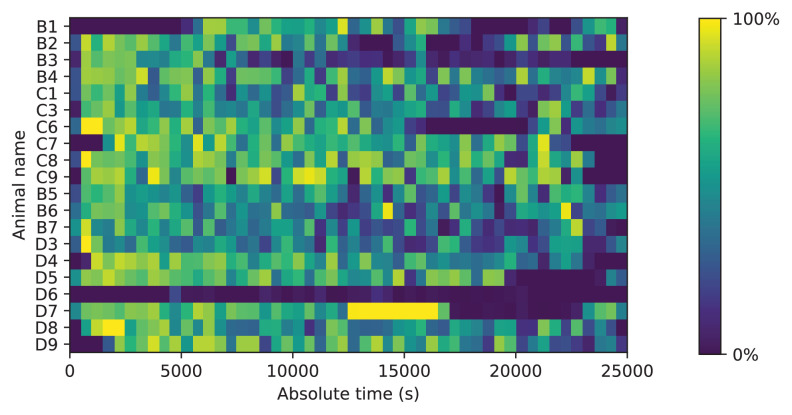
Fraction of time spent in the maze. Mice could move freely between the home cage and the maze. For each animal (vertical), the fraction of time in the maze (color scale) is plotted as a function of time since start of the experiment. Time bins are 500 s. Note that mouse D6 hardly entered the maze; it never progressed beyond the first junction. This animal was excluded from all subsequent analysis steps.
Figure 1—figure supplement 2. Fraction of time in maze by group.

Figure 1—figure supplement 2.

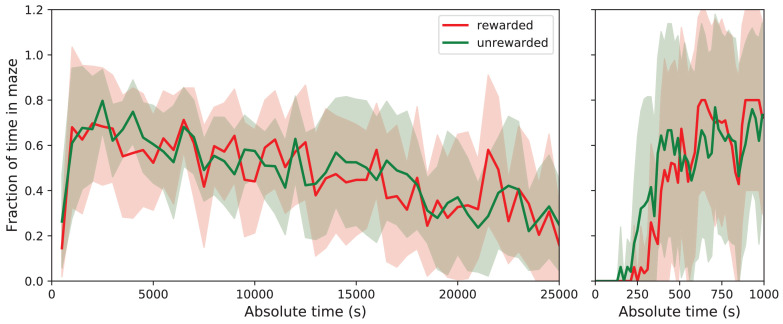
Average fraction of time spent in the maze by group. This shows the average fraction of time in the maze as Mean ± SD over the population of 10 rewarded and nine unrewarded animals. Right: expanded axis for early times. The tunnel to the maze opens at time 0. Rewarded and unrewarded animals used the maze in remarkably similar ways. Exploration of the maze began around 250 s after tunnel opening. Within the next 250 s, the maze occupancy rose quickly to ~70%, then declined gradually over 7 h to ~30%.
Figure 1—figure supplement 3. Transitions between cage and maze.

Figure 1—figure supplement 3.

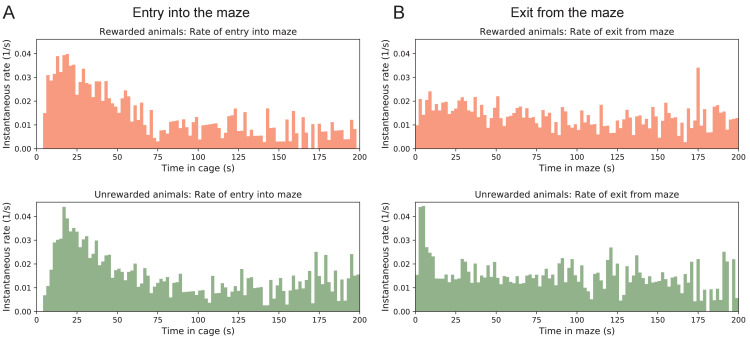
Rates of transition between cage and maze. (A) The instantaneous probability per unit time rm(t) of entering the maze after having spent time t in the cage. Note this rate is highest immediately upon entering the cage, then declines by a large factor. (B) The instantaneous probability per unit time rc(t) of exiting the maze after having spent time t in the maze.