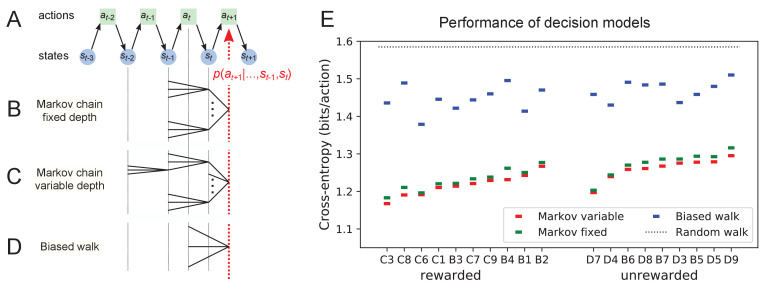
Figure 11. Recent history constrains the mouse’s decisions.
(A) The mouse’s trajectory through the maze produces a sequence of states . From each state, up to three possible actions lead to the next state (end nodes allow only one action). We want to predict the animal’s next action, , based on the prior history of states or actions. (B–D) Three possible models to make such a prediction. (B) A fixed-depth Markov chain where the probability of the next action depends only on the current state and the preceding state . The branches of the tree represent all possible histories . (C) A variable-depth Markov chain where only certain branches of the tree of histories contribute to the action probability. Here one history contains only the current state, some others reach back three steps. (D) A biased random walk model, as defined in Figure 9, in which the probability of the next action depends only on the preceding action, not on the state. (E) Performance of the models in (B,C,D) when predicting the decisions of the animal at T-junctions. In each case we show the cross-entropy between the predicted action probability and the real actions of the animal (lower values indicate better prediction, perfect prediction would produce zero). Dotted line represents an unbiased random walk with 1/3 probability of each action.


