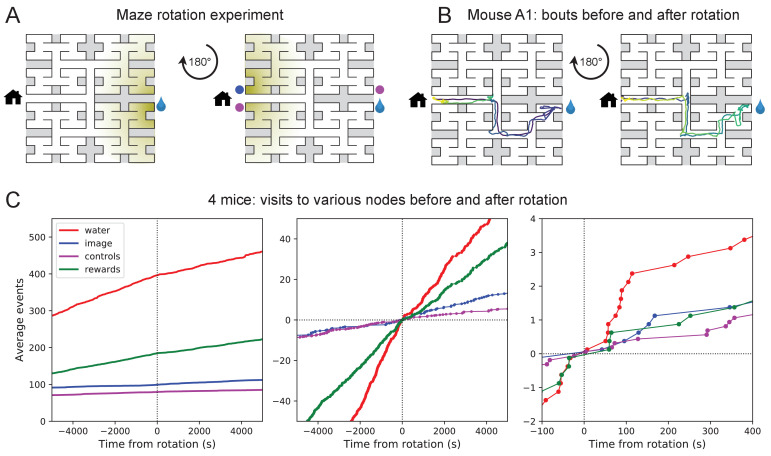
Figure 4. Navigation is robust to rotation of the maze.
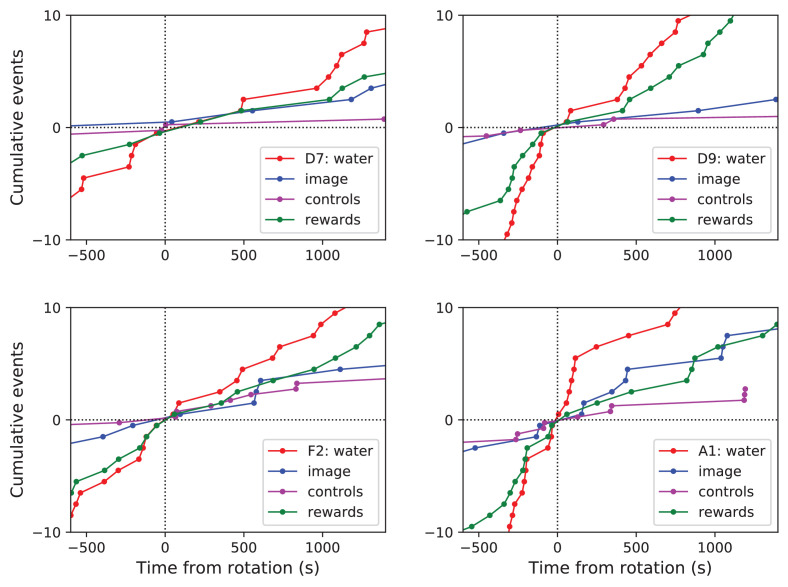
(A) Logic of the experiment: The animal may have deposited an odorant in the maze (shading) that is centered on the water port. After 180 degree rotation of the maze, that gradient would lead to the image of the water port (blue dot). We also measure how often the mouse goes to two control nodes (magenta dots) that are related by symmetry. (B) Trajectory of mouse ‘A1’ in the bouts immediately before and after maze rotation. Time coded by color from dark to light as in Figure 2. (C) Left: Cumulative number of rewards as well as visits to the water port, the image of the water port, and the control nodes. All events are plotted vs time before and after the maze rotation. Average over four animals. Middle and right: Same data with the counts centered on zero and zoomed in for better resolution.


