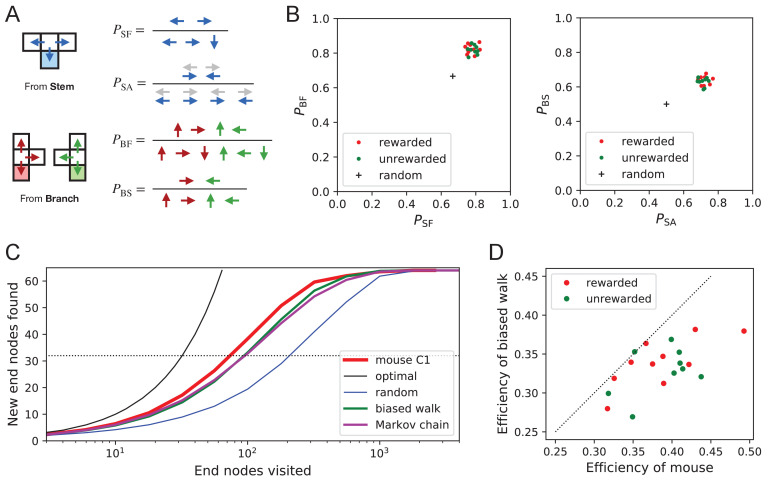
Figure 9. Turning biases favor exploration.
(A) Definition of four turning biases at a T-junction based on the ratios of actions taken. Top: An animal arriving from the stem of the T (shaded) may either reverse or turn left or right. is the probability that it will move forward rather than reversing. Given that it moves forward, is the probability that it will take an alternating turn from the preceding one (gray), that is left-right or right-left. Bottom: An animal arriving from the bar of the T may either reverse or go straight, or turn into the stem of the T. is the probability that it will move forward through the junction rather than reversing. Given that it moves forward, is the probability that it turns into the stem. (B) Scatter graph of the biases and (left) and and (right). Every dot represents a mouse. Cross: values for an unbiased random walk. (C) Exploration curve of new end nodes discovered vs end nodes visited, displayed as in Figure 8A, including results from a biased random walk with the four turning biases derived from the same mouse, as well as a more elaborate Markov-chain model (see Figure 11C). (D) Efficiency of exploration (Equation 1) in 19 mice compared to the efficiency of the corresponding biased random walk.

