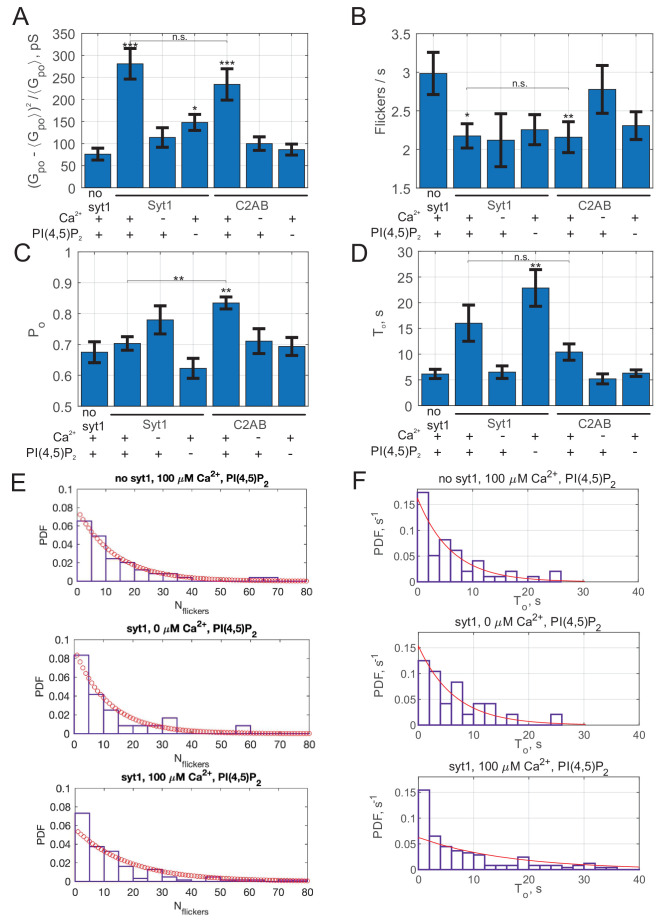
Appendix 1—figure 3. Additional properties of single fusion pores in the presence of full-length Syt1 or soluble C2AB.
Open-pore conductance fluctuations relative to mean (A), average flicker rate during a burst (B), average open-pore probability, , during a current burst (fraction of time pore is in the open state during a burst) (C), and average burst lifetime, , (D) for the indicated conditions. (E) Distributions of the number of flickers per burst, , for the indicated conditions. Fits to geometric distributions are shown in red, . Best fit parameters (with ± 95% confidence intervals) are (no Syt1, 100 μM Ca2+, averaged over 49 individual fusion pores from 10 cells, mean ), 0.083(0.051,0115) (Syt1, 0 μM Ca2+; averaged over 24 individual fusion pores from 11 cells, mean ), 0.053(0.044,0.063) (Syt1, 100 μM Ca2+; averaged over 123 individual fusion pores from 20 cells, mean ). (F) Distribution of burst lifetimes, for the indicated conditions. Best fits to single exponentials are shown as red curves, with means (and 95% confidence intervals) as follows. No Syt1, 100 μM Ca2+: 6.1 s (4.7 to 8.3 s, 49 fusion pores from 10 cells), Syt1, 0 μM Ca2+: 6.5 s (4.5 to 10.1 s, 24 fusion pores from 11 cells), Syt1, 100 μM Ca2+: 16 s (13.5 to 19.3 s, 123 fusion pores from 20 cells). In A-D, the two-sample Kolmogorov-Smirnov test was used to assess significant differences between the "no C2AB" group and the rest. *, **, *** indicate p<0.05, 0.01, and 0.001, respectively. Comparison between Syt1 and C2AB in the presence of Ca2+ and PI(4,5)P2 are also indicated (using the two-sample Kolmogorov-Smirnov test).

