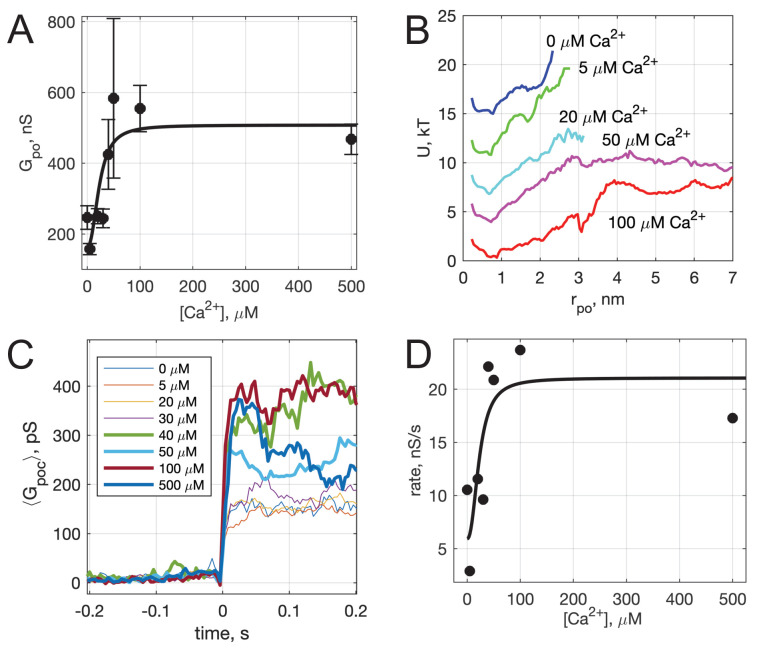
Figure 4. Calcium-dependence of pore properties.
(A) Mean single open-pore conductance, , as a function of free calcium concentration in the pipette solution. Plotted values are mean ± S.E.M. A fit to a Hill equation is shown as the black line, where , , and (see text). Best fit parameters (with 95% confidence bounds) were , and . (B) Apparent free energy profiles, calculated as in Figure 2E, for different calcium concentrations. (C) Kinetics of pore expansion for different [Ca2+]free as indicated. Conductance traces were aligned to the first point in a pore and averaged. (D) Expansion rates of time-aligned and averaged conductances as a function of [Ca2+]free. Expansion rates were calculated as the 10-90% rise time from the baseline to the level of conductance reached within the first 100 ms after pore opening, divided by the time it took for this rise (see Appendix 1, Supplementary Materials and methods). A fit to a Hill equation as in A is also shown, using the same and parameter values.

