Figure 1. The Pik-1/Pik-2 orthologues are distributed across diverse species of grasses.
(A) The maximum likelihood (ML) phylogenetic trees of Pik-1 (left) and Pik-2 (right) orthologues. The trees were calculated from 927- and 1239-nucleotide-long codon-based alignments of the NB-ARC domain, respectively, using RAxML v8.2.11 (Stamatakis, 2014), 1000 bootstrap method (Felsenstein, 1985), and GTRGAMMA substitution model (Tavaré, 1986). Best ML trees were manually rooted using the selected clades (marked with grey circles) as outgroups. The bootstrap values above 70% are indicated with grey triangles at the base of respective clades; the support values for the relevant nodes are depicted with numbers. The scale bars indicate the evolutionary distance based on nucleotide substitution rate. The Pik-1 integration clade is shown in pink. Genetically linked genes are linked with lines, with colours indicating plant subfamily: Oryzoideae (purple), Pooideae (dark green), or Panicoideae (light green); the continuous lines represent linkage in a head-to-head orientation, the dashed line indicates linkage in a tail-to-tail orientation. The interactive trees are publicly available at: https://itol.embl.de/tree/14915519290329341598279392 and https://itol.embl.de/tree/14915519290161451596745134. (B) Schematic illustration of the Pik locus in selected species. The schematic gene models of Pik-1 (blue) and Pik-2 (grey) are shown. The integrated heavy metal-associated (HMA) domain is marked with pink. The coordinates of the regions presented in this figure are summarised in Supplementary file 1E. (C) Comparisons of pairwise dS rates calculated for the Pik-1 and Pik-2 receptors. The rates were calculated using Yang and Nielsen, 2000 based on 972- and 1269-nucleotide-long codon-based alignments of the NB-ARC domains of Pik-1 and Pik-2, respectively; only positions that showed over 70% coverage across the alignment were used for the analysis. The comparisons were categorised to reflect species divergence (shapes) and colour-coded to illustrate percentage identity of dS values (% identity). The coefficient of determination (R2) was calculated for each dataset using R v3.6.3 package. (D) Summary of identified Pik-1 and Pik-2 homologues in plant species included in this study. The phylogenetic tree was generated using TimeTree tool (Kumar et al., 2017). The number of pairs correspond to the number of Pik-1/Pik-2 genes in a head-to-head orientation separated by intergenic region of various length. **The species harbours a truncated gene between Pik-1 and Pik-2; *the species has likely lost the HMA domain; Pik-1–HMA: Pik-1 with the HMA domain; Pik-1: Pik-1 without the HMA integration; BOP: Bambusoideae, Oryzoideae, Pooideae; PACMAD: Panicoideae, Arundinoideae, Chloridoideae, Micrairoideae, Aristidoideae, Danthonioideae.
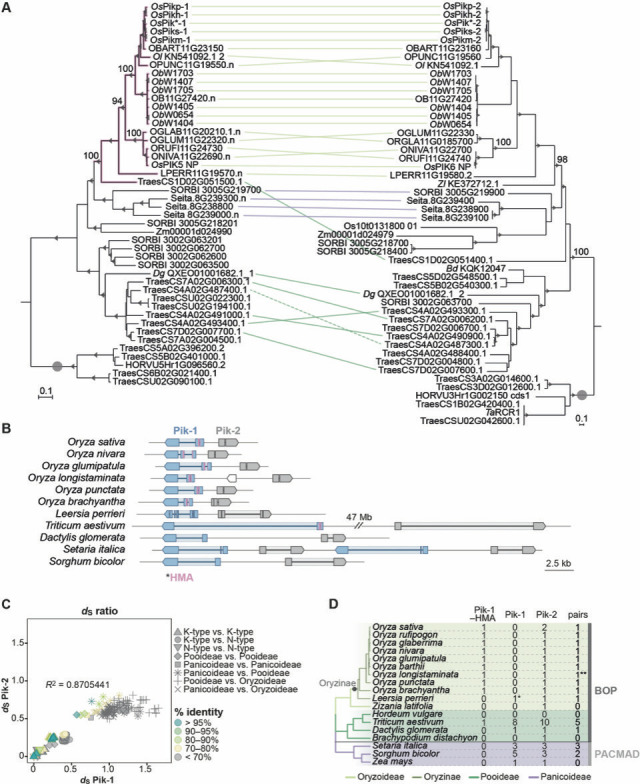
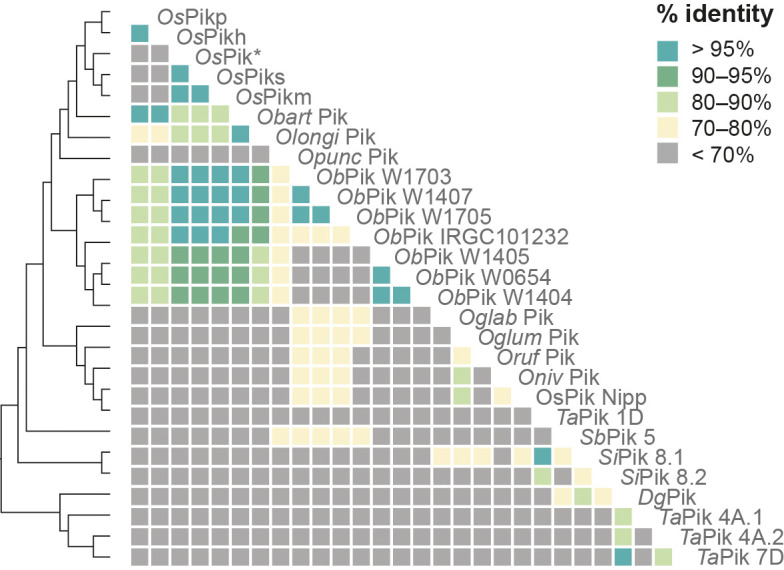
Figure 1—figure supplement 1. Pik-1 and Pik-2 orthologues fall into two well-supported clades.

Figure 1—figure supplement 2. Genotyping of Oryza brachyantha accession.

Figure 1—figure supplement 3. Pik-1 and Pik-2 orthologues from Oryza spp. fall into K- and N-type clades.

Figure 1—figure supplement 4. Schematic representation of selected Pik clusters in wheat (T. aestivum), sorghum (S. bicolor), and foxtail millet (S. italica).

Figure 1—figure supplement 5. Random pairwise comparisons of dS rates calculated for the Pik-1 and Pik-2 receptors.

Figure 1—figure supplement 6. Genetically linked Pik-1 and Pik-2 have similar molecular age.