. 2021 Jul 21;10:e66961. doi: 10.7554/eLife.66961

Figure 3. The integrated heavy metal-associated (HMA) domain of Pikp-1 exhibits stronger association with the AVR-PikD effector than its predicted ancestral state.

(A) Overview of the strategy for resurrection of the ancestral HMA (ancHMA) domain. Following ancestral sequence reconstruction, the gene sequences were synthesised and incorporated into Pikp-1 by replacing the present-day Pikp-HMA domain (blue) with the ancHMA equivalent (green). (B) Co-immunoprecipitation experiment between AVR-PikD (N-terminally tagged with FLAG) and Pikp-1 (N-terminally tagged with HA) carrying ancestral sequences of the HMA. Wild-type (WT) HA:Pikp-1 and HA:Pikp-1E230R were used as a positive and negative control, respectively. Immunoprecipitates (HA-IP) obtained with anti-HA probe and total protein extracts (Input) were immunoblotted with appropriate antisera (listed on the right). Rubisco loading control was performed using Pierce staining solution. Arrowheads indicate expected band sizes. Results from three independent replicates of this experiment are shown in Figure 3—figure supplement 3.

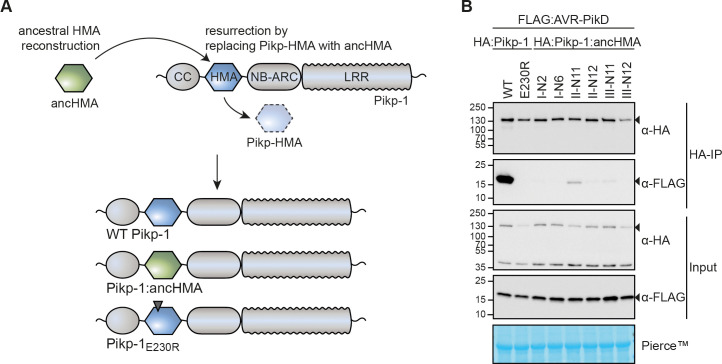
Figure 3.

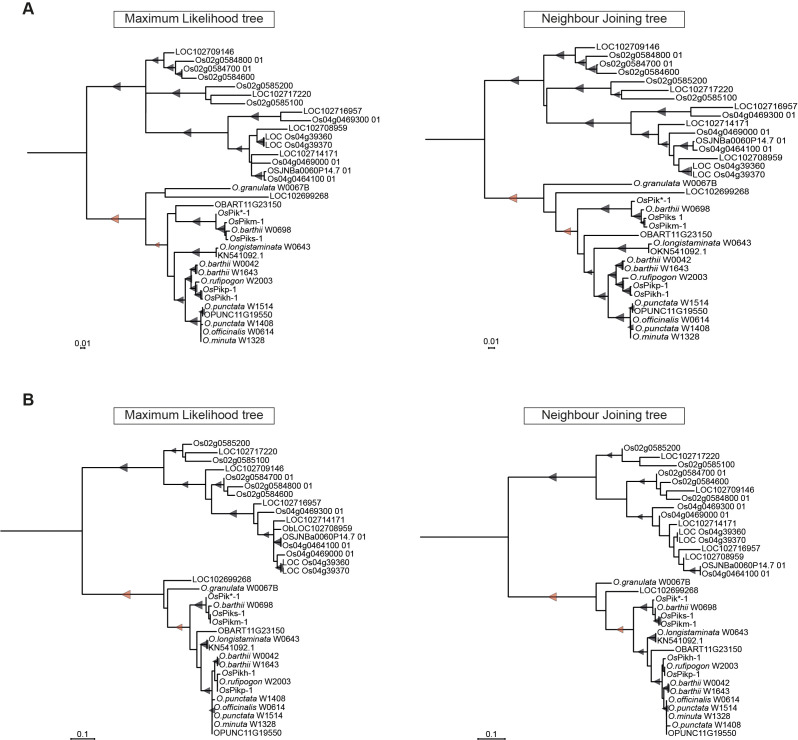
Figure 3—figure supplement 1. Phylogenetic analyses of the heavy metal-associated (HMA) domain of K-type Pik-1 NLRs.

Figure 3—figure supplement 1.

The phylogenetic trees were built using MEGA X software (Kumar et al., 2018) and bootstrap method based on 1000 iterations (Felsenstein, 1985). Codon-based 249-nucleotide-long alignment was generated using MUSCLE Edgar, 2004; positions with less than 50% site coverage were removed prior to the analysis, resulting in 234 positions in the final dataset. The relevant bootstrap values with support over 60% are shown with triangles at the base of representative clades; the size of the triangle is proportional to the bootstrap value. The scale bars indicate the evolutionary distance based on nucleotide substitution rate. Each tree was manually rooted using a clade of non-integrated HMA as an outgroup. The nodes selected for the ancestral sequence reconstruction are marked with red triangles. (A) Maximum likelihood (ML) and neighbour joining (NJ) trees calculated based on all codon positions in the alignment. (B) ML and NJ trees calculated based on third codon position in the alignment.
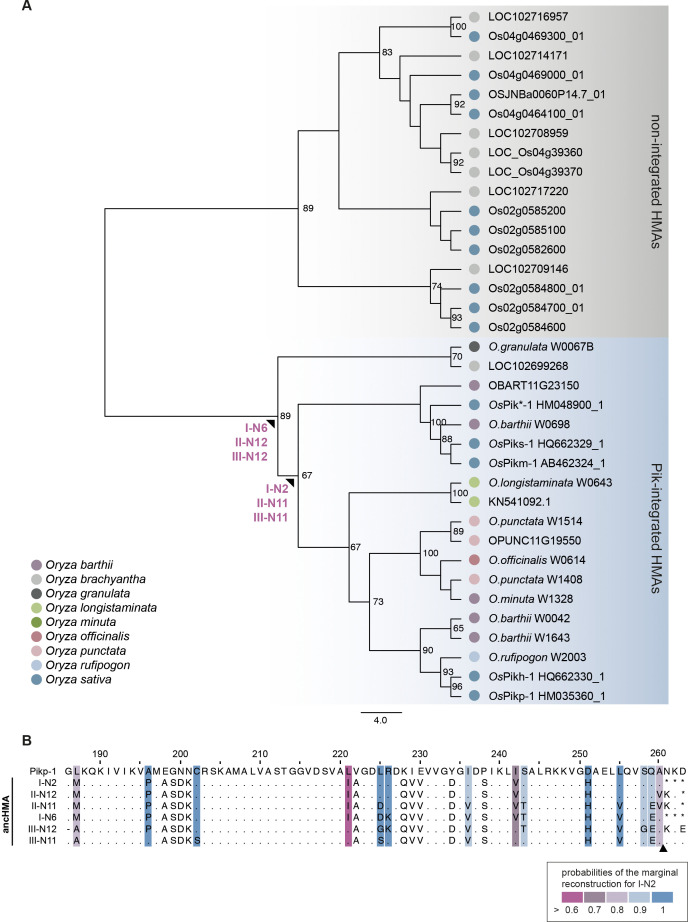
Figure 3—figure supplement 2. Ancestral sequence reconstruction yielded multiple plausible ancestral HMA (ancHMA) sequences.

Figure 3—figure supplement 2.

(A) Representative neighbour joining (NJ) phylogenetic tree of the heavy metal-associated (HMA) domain. The tree was built using JTT substitution model (Jones et al., 1992) and bootstrap method with 100 iterations test (Felsenstein, 1985). Alignment of 98 amino acids of integrated (blue) and non-integrated (grey) HMAs was generated with MUSCLE (Edgar, 2004). Bootstrap values above 65% are shown at the base of respective clades. Nodes for which the ancestral sequence reconstruction was performed are marked with arrowheads. The scale bar indicates the evolutionary distance based on the number of base substitutions per site. (B) Protein sequence alignment of representative ancHMA predictions. Amino acids for which sequence prediction was not performed are replaced with asterisk (*). The probabilities of the marginal reconstruction for I-N2 sequence are marked with coloured boxes. An arrowhead indicates the length of the construct used in further studies concerning Pikp-1.
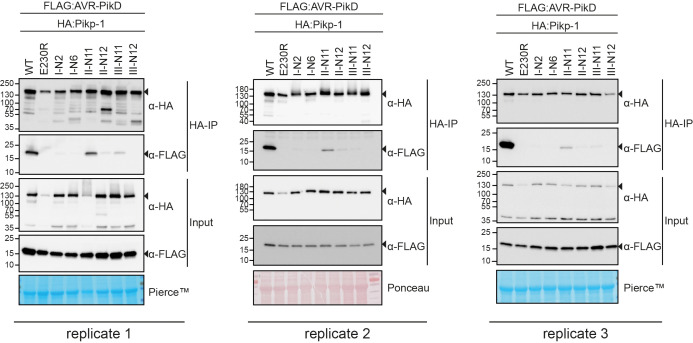
Figure 3—figure supplement 3. Replicates of the co-immunoprecipitation (co-IP) experiment between AVR-PikD and the reconstructed ancestral HMA (ancHMA) sequences.

Figure 3—figure supplement 3.

Co-IP experiment between AVR-PikD (N-terminally tagged with FLAG) with Pikp-1 with ancestral sequences of HMA (N-terminally tagged with HA). Wild-type (WT) HA:Pikp-1 and HA:Pikp-1E230R were used as positive and negative controls, respectively. Immunoprecipitates (HA-IP) obtained using anti-HA probes and total protein extracts (Input) were immunoblotted with appropriate antisera (listed on the right). Rubisco loading control was performed using Pierce or Ponceau staining solutions. Arrowheads indicate expected band sizes. The figure shows the results from three independent experiments.