. 2021 Jul 21;10:e66961. doi: 10.7554/eLife.66961

Figure 5. The AV-VE substitutions within the IAQVV/LVKIE region of ancestral HMA (ancHMA) increase binding to AVR-PikD.

(A) Schematic representation of a neighbour joining (NJ) phylogenetic tree of the heavy metal-associated (HMA) domain from Oryza spp. (shown in Figure 3—figure supplement 2). The scale bar indicates the evolutionary distance based on the number of base substitutions per site. Historical mutations in the IAQVV/LVKIE region acquired over the course of Pikp-HMA evolution are shown next to the appropriate nodes. The mutations are colour-coded to match the ancestral (green) and present-day (blue) states. (B) Co-immunoprecipitation (Co-IP) experiment illustrating in planta association of AVR-PikD (N-terminally tagged with FLAG) with Pikp-1 and Pikp-1:ancHMA (N-terminally tagged with HA), labelled above. Wild-type (WT) HA:Pikp-1 and HA:Pikp-1E230R proteins were used as a positive and negative control, respectively. Immunoprecipitates (HA-IP) obtained with anti-HA probe and total protein extracts (input) were immunoblotted with appropriate antibodies (listed on the right). Loading control, featuring Rubisco, was performed using Pierce staining. The arrowheads indicate expected band sizes. Three independent replicates of this experiment are shown in Figure 5—figure supplement 2. (C) Plot illustrating calculated percentage of the theoretical maximum response (%Rmax) values for interaction of HMA analytes, labelled below, with AVR-PikD ligand (featuring C-terminal HIS tag) determined using surface plasmon resonance. %Rmax was normalised for the amount of ligand immobilised on the NTA-sensor chip. The chart summarises the results obtained for HMA analytes at 400 nM concentration from three independent experiments with two internal repeats. Three different concentrations of the analytes (400 nM, 200 nM, 50 nM) were tested; results for the 200 nM and 50 nM concentrations are shown in Figure 5—figure supplement 4. Average Δ%Rmax (•) values represent absolute differences between values for ‘binding’ and ‘dissociation’, calculated from the average values for each sample, and serve as an off-rate approximate. Statistical differences among the samples were analysed with Tukey’s honest significant difference (HSD) test (p<0.01); p-values for all pairwise comparisons are presented in Supplementary file 1I.

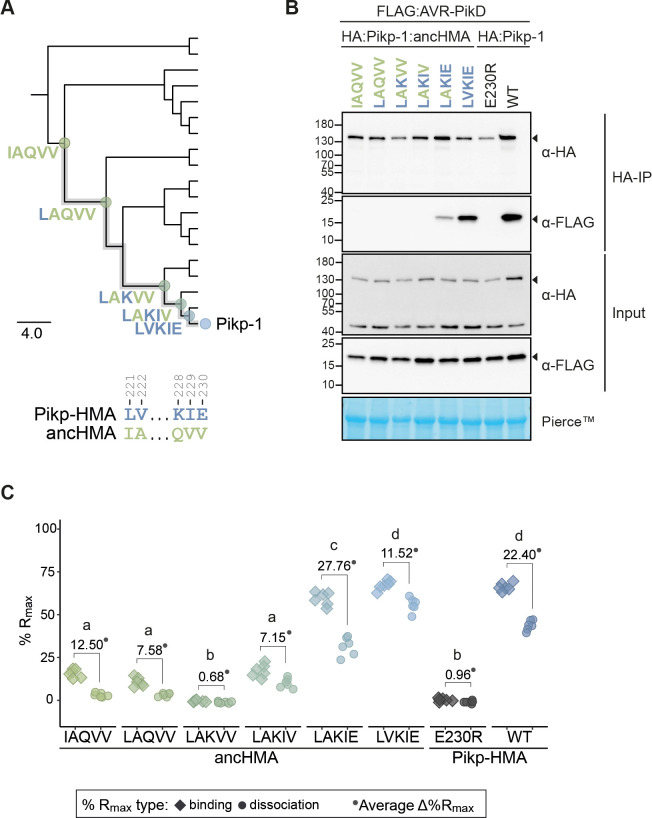
Figure 5—source data 1. Raw data of Pikp-ancHMA Rmax SPR.

Figure 5.

Figure 5—figure supplement 1. Co-immunoprecipitation experiment between AVR-PikD and the two plausible historical states of the IAQVV/LVKIE region within Pikp-HMA.

Figure 5—figure supplement 1.

In planta association of AVR-PikD (N-terminally tagged with FLAG) Pikp-1, Pikp-1E230R, Pikp-1:ancHMA, and Pikp-1:ancHMA mutants (N-terminally tagged with HA), labelled above. Wild-type (WT) HA:Pikp-1 and HA:Pikp-1E230R, with HA tag, were used as a positive and negative control, respectively. Immunoprecipitates (HA-IP) obtained using anti-HA probe and total protein extracts (input) were immunoblotted with the appropriate antisera labelled on the right. Arrowheads indicate expected band sizes. Loading controls, featuring Rubisco, were performed using Pierce or Ponceau staining solutions. The figure shows the results from two independent experiments.
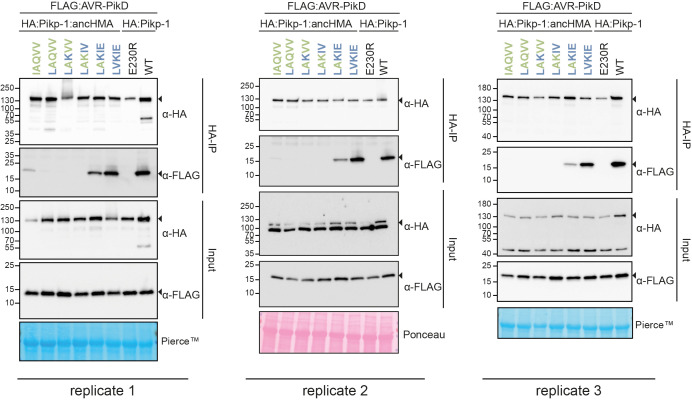
Figure 5—figure supplement 2. Replicates of the co-immunoprecipitation (co-IP) experiments between the Pikp-1:ancHMA IAQVV/LVKIE mutants and AVR-PikD.

Figure 5—figure supplement 2.

In planta association of AVR-PikD (N-terminally tagged with FLAG) with Pikp-1, Pikp-1E230R, Pikp-1:ancHMA, and Pikp-1:ancHMA mutants (N-terminally tagged with HA), labelled above. Wild-type (WT) Pikp-1 and Pikp-1E230R were used as a positive and negative control, respectively. Proteins obtained by co-IP with HA-probe (HA-IP) and total protein extracts (input) were immunoblotted with the appropriate antisera labelled on the right. Rubisco loading controls were conducted using Pierce or Ponceau staining solutions. Arrowheads demonstrate expected band sizes. The figure shows the results from three independent experiments.
Figure 5—figure supplement 3. Purified proteins used in surface plasmon resonance studies.

Figure 5—figure supplement 3.

(A) Coomassie Brilliant Blue-stained SDS-PAGE gel showing purified heavy metal-associated (HMA) proteins used in in vitro experiments. Dashed lines signify different components of the same gel. (B) Table summarising intact masses (monoisotopic) of proteins from (A).
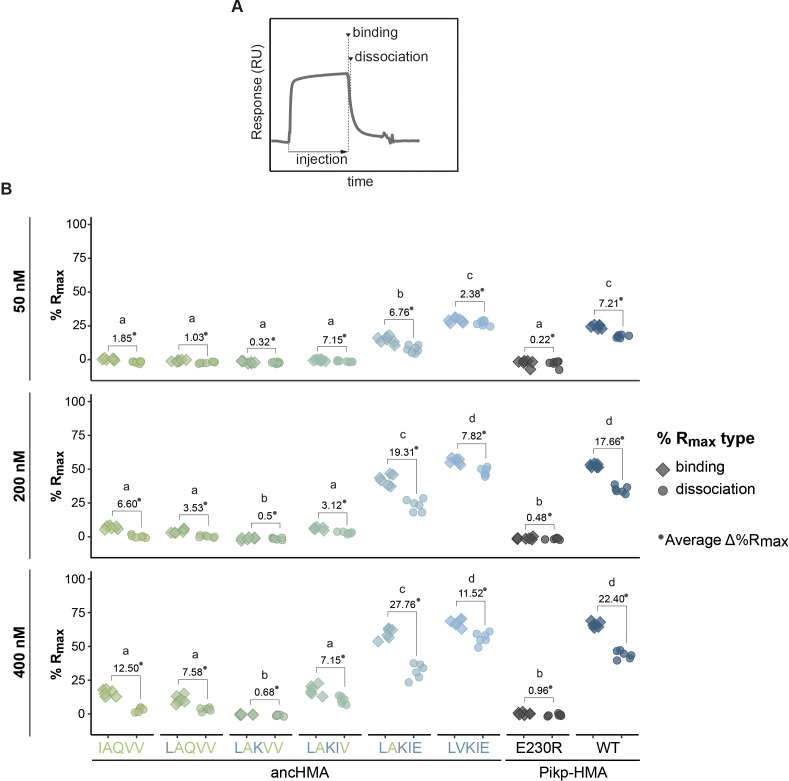
Figure 5—figure supplement 4. Surface plasmon resonance (SPR) results show the effect of the IAQVV-LVKIE mutations on the AVR-PikD binding, as indicated by %Rmax.

Figure 5—figure supplement 4.

(A) Schematic representation of the SPR sensorgrams showcasing the measurements taken to monitor binding dynamics: ‘binding’ and ‘dissociation’. (B) Plots illustrating calculated percentage of the theoretical maximum response values (%Rmax) for interaction of the heavy metal-associated (HMA) analytes, labelled below, with AVR-PikD ligand (C-terminally tagged with HIS). %Rmax was normalised for the amount of ligand immobilised on the NTA-sensor chip. The HMA analytes were tested at three different concentrations, indicated on the left, in three independent experiments with two internal replicates. All data points are represented as diamonds or circles. Average Δ%Rmax (•) values represent absolute differences between values for ‘binding’ and ‘dissociation’, calculated from the average values for each sample, and serve as an off-rate approximate. Statistical differences among the samples were analysed with ANOVA and Tukey’s honest significant difference (HSD) test (p<0.01); p-values for all pairwise comparisons are presented in Supplementary file 1I.
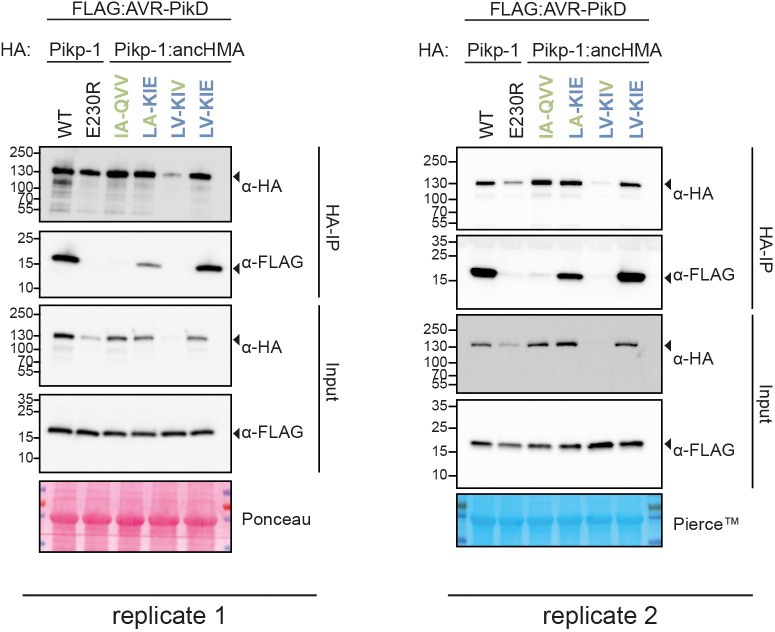
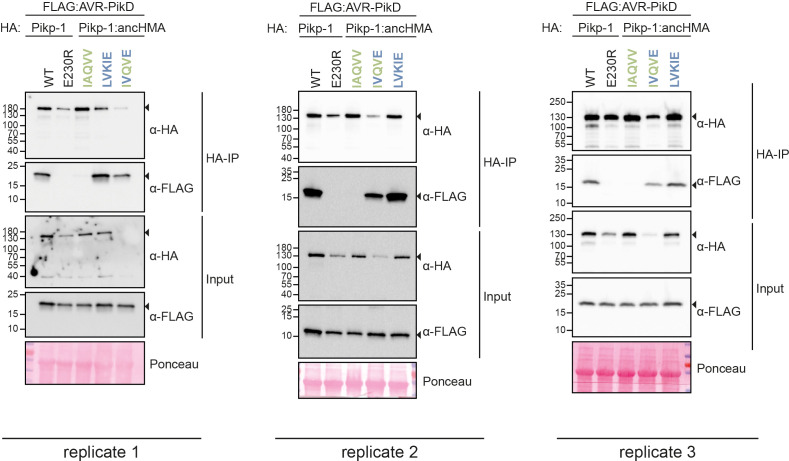
Figure 5—figure supplement 5. The AV-VE (Ala-222-Val and Val-230-Glu) substitutions are sufficient to increase binding affinity towards the AVR-PikD effector in co-immunoprecipitation (co-IP).

Figure 5—figure supplement 5.

Co-IP experiments between AVR-PikD (N-terminally tagged with FLAG) and Pikp-1 and Pikp-1:ancHMA constructs (N-terminally tagged with HA), labelled above. Wild-type (WT) HA:Pikp-1 and HA:Pikp-1E230R mutant were used as a positive and negative control, respectively. Immunoprecipitates (HA-IP) obtained using anti-HA resin and total protein extracts (input) were immunoblotted with the appropriate antisera labelled on the right. Loading control, featuring Rubisco, was performed using Ponceau staining. The black arrowheads point to expected band sizes. The figure shows the results from three independent experiments.