. 2021 Jul 21;10:e66961. doi: 10.7554/eLife.66961

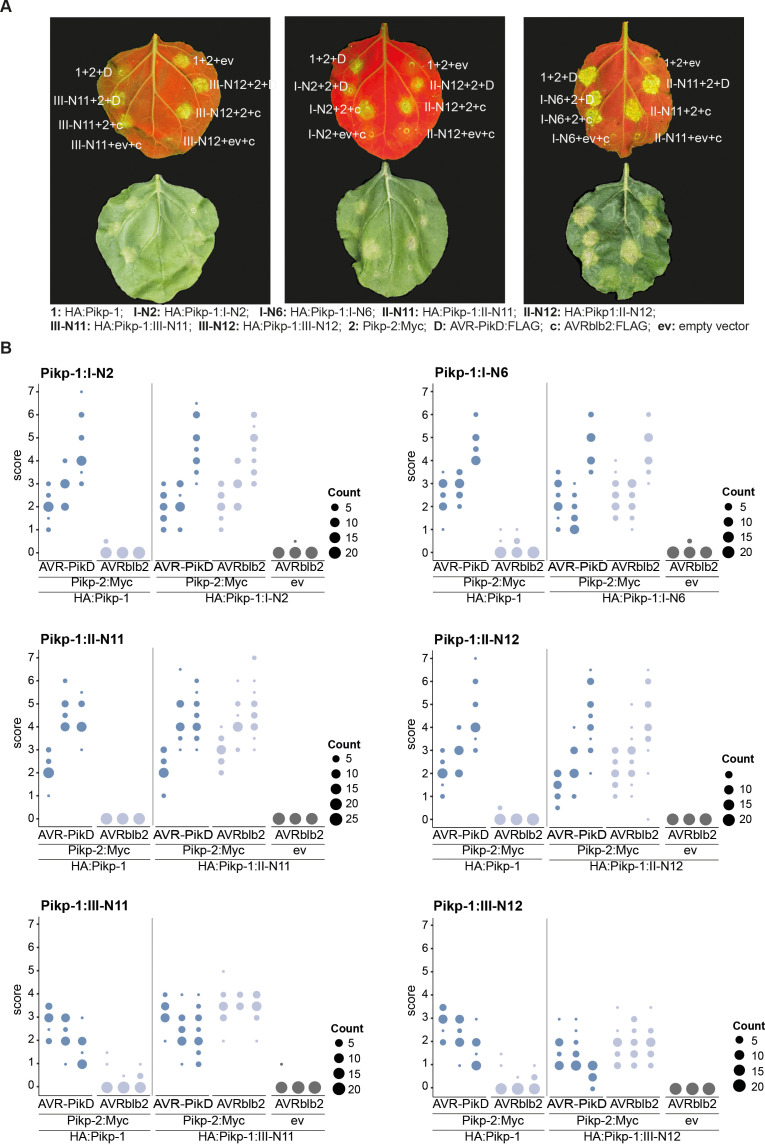
Figure 6. Pikp-1:ancHMALVKIE* and Pikp-1:ancHMALAKIE* mediate immune response towards the AVR-PikD effector.

(A) Schematic representation of wild-type Pikp-1 and Pikp-1:ancHMA fusions used in the assay. The mutated regions are presented with arrowheads and listed. (B) Representative images of hypersensitive response (HR) cell death assay after transient co-expression of the Pikp-1:ancHMA* mutants (C-terminally tagged with HF) with AVR-PikD (N-terminally tagged with Myc) and Pikp-2 (C-terminally tagged with HA). Empty vector (ev) was used as a negative control. All constructs were co-expressed with the gene silencing suppressor p19 (Win and Kamoun, 2003). The leaves were photographed 5 days after infiltration under daylight (left) and UV light (right). (C) HR was scored at 5 days post-agroinfiltration. The results are presented as dot plots, where the size of a dot is proportional to the number of samples with the same score (count) within the same biological replicate. The experiment was independently repeated at least three times with 23–24 internal replicates; the columns within tested conditions (labelled on the bottom) correspond to results from different biological replicates. Significant differences between relevant conditions are marked with an asterisk (*); details of the statistical analysis are summarised in Figure 6—figure supplement 5.

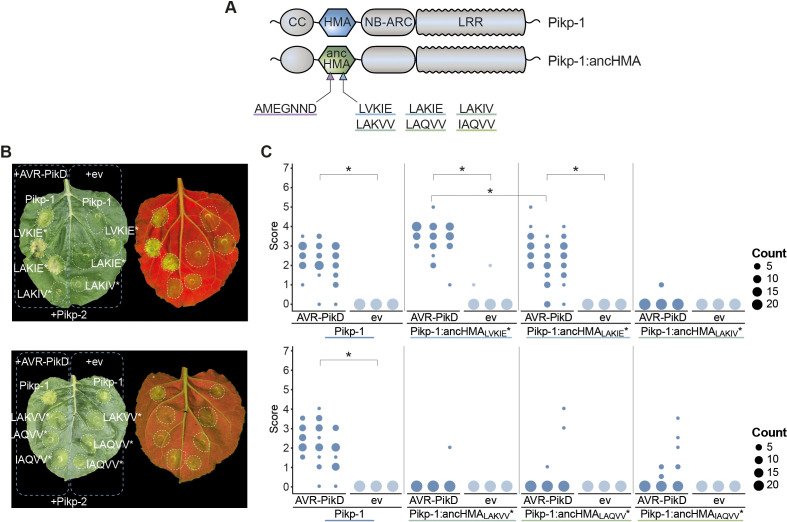
Figure 6—source data 1. Hypersensitive response scores for IAQVV to LVKIE mutations in Pikp-HMA.

Figure 6.

Figure 6—figure supplement 1. Pikp-1:ancHMA fusions are autoactive in a Pikp-2-dependent manner.

Figure 6—figure supplement 1.

Hypersensitive response (HR) assay after transient co-expression of Pikp-1:HMA variants (N-terminally tagged with HA) with AVR-PikD (N-terminally tagged with FLAG) and Pikp-2 (C-terminally tagged with Myc). AVRblb2 and the empty vector (ev) were used as negative controls. (A) Representative N. benthamiana leaves infiltrated with samples (labelled next to the infiltration spot) were photographed 5 days post infiltration under UV (left) and daylight (right). (B) HR was scored 5 days after agroinfiltration. The results are presented as dots plot, where the size of a dot is proportional to the number of samples with the same score (count) within the same replicate. The experiment was repeated at least three times with 22–26 internal replicates; the columns within tested conditions (labelled on the bottom) show results from different biological replicates. The statistical analyses of these results are presented in Figure 6—figure supplement 2.
Figure 6—figure supplement 1—source data 1. Hypersensitive response scores used in Figure 6—figure supplement 1.
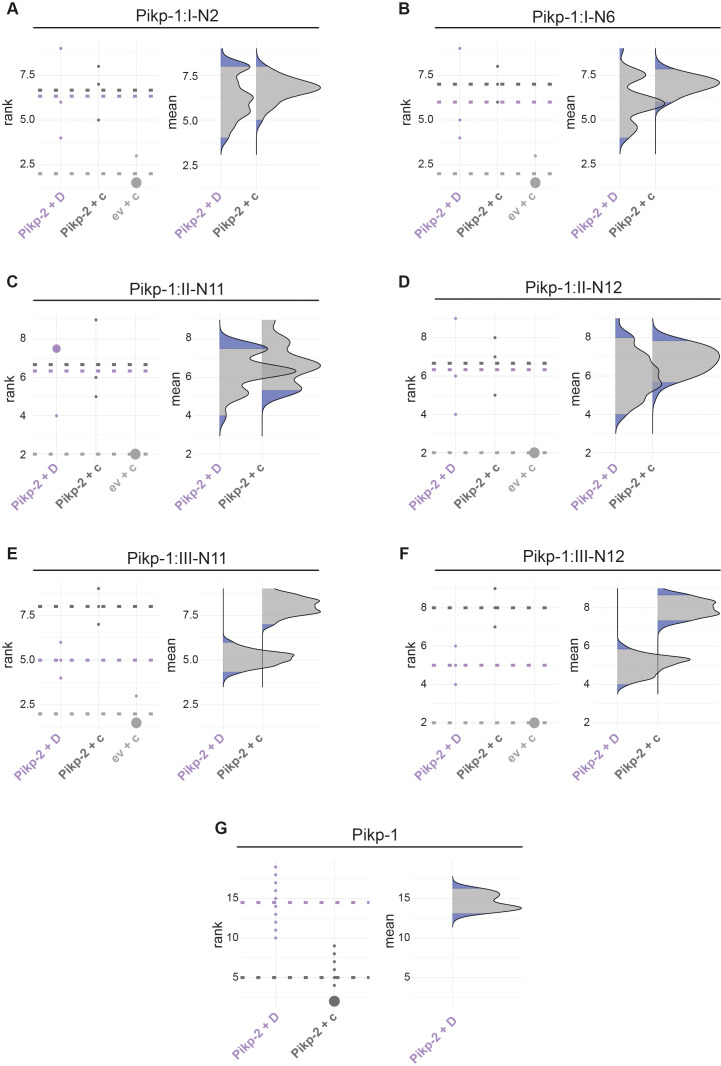
Figure 6—figure supplement 2. Statistical analysis of hypersensitive response cell death for the Pikp-1:ancHMA fusions.

Figure 6—figure supplement 2.

The statistical analysis was conducted using an estimation method using besthr R library (MacLean, 2019). (AG) Each panel corresponds to a different Pikp-1:ancHMA fusion (labelled above), co-expressed with Pikp-2 and AVR-PikD (Pikp-2 + D), Pikp-2 and AVRblb2 (Pikp-2 + c), or empty vector and AVRblb2 (ev + c). AVRblb2 and empty vector were used as controls. The left panels represent the ranked data (dots) and their corresponding mean (dashed line), with the size of a dot proportional to the number of observations with that specific value. The panels on the right show the distribution of 1000 bootstrap sample rank means, with the blue areas illustrating the 0.025 and 0.975 percentiles of the distribution. The difference is considered significant if the ranked mean for a given condition falls within or beyond the blue percentile of the mean distribution for another condition.
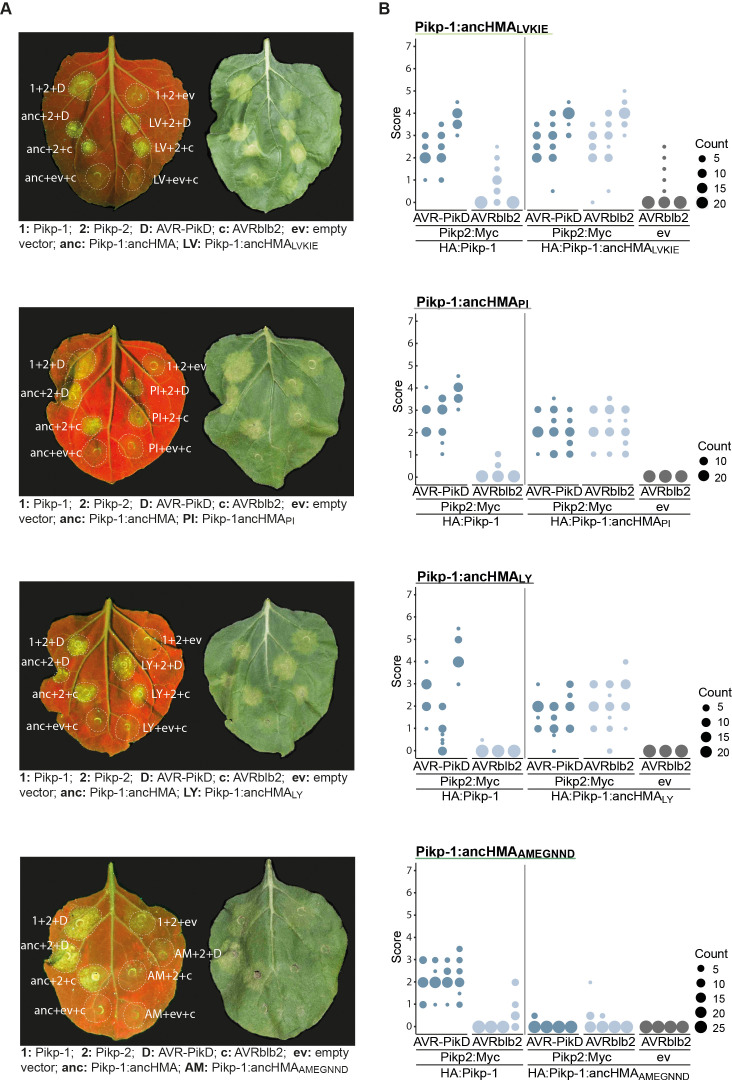
Figure 6—figure supplement 3. The AMEGNND mutations within ancestral HMA (ancHMA) abolish autoactivity.

Figure 6—figure supplement 3.

Hypersensitive response (HR) assay after transient co-expression of Pikp-1:HMA mutants (N-terminally tagged with HA) with AVR-PikD (N-terminally tagged with FLAG) and Pikp-2 (C-terminally tagged with Myc). AVRblb2 and the empty vector (ev) were used as negative controls. (A) Representative N. benthamiana leaves infiltrated with appropriate constructs (labelled next to the infiltration spot) were photographed 5 days post-infiltration under UV (left) and daylight (right). (B) HR was scored 5 days after agroinfiltration. The results are presented as dot plots where the size of a dot is proportional to the number of samples with the same score (count) within the same biological replicate. The experiment was independently repeated at least three times with 20–28 internal replicates; the columns within tested conditions (labelled on the bottom) illustrate results from different biological replicates. The statistical analyses of these results are presented in Figure 6—figure supplement 4.
Figure 6—figure supplement 3—source data 1. Hypersensitive response scores used in Figure6—figure supplement 3.
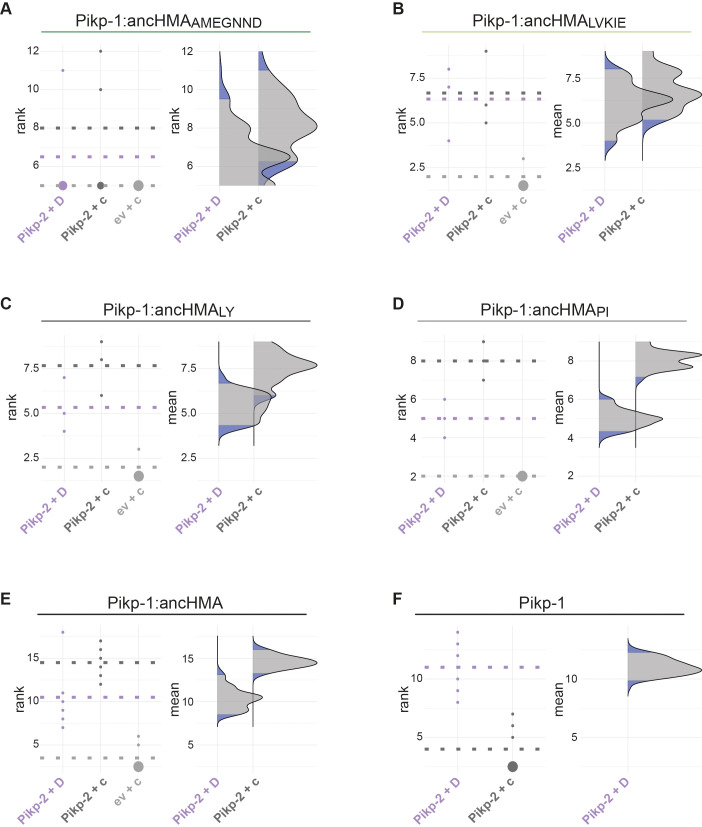
Figure 6—figure supplement 4. Statistical analysis of cell death assay for the Pikp-1:ancHMA chimeras.

Figure 6—figure supplement 4.

The statistical analysis was carried out using an estimation method implemented in besthr R library (MacLean, 2019). (A–F) Each panel corresponds to a different chimera of Pikp-1:ancHMA (labelled above), co-expressed with Pikp-2 and AVR-PikD (Pikp-2 + D), Pikp-2 and AVRblb2 (Pikp-2 + c), or empty vector and AVRblb (ev + c). AVRblb2 and empty vector were used as controls. The left panels represent the ranked data (dots) and their corresponding mean (dashed line), with the size of a dot proportional to the number of observations with that specific value. The panels on the right show the distribution of 1000 bootstrap sample rank means, with the blue areas corresponding to the 0.025 and 0.975 percentiles of the distribution. The difference is considered statistically significant if the ranked mean for a given condition falls within or beyond the blue percentile of the mean distribution for another condition.
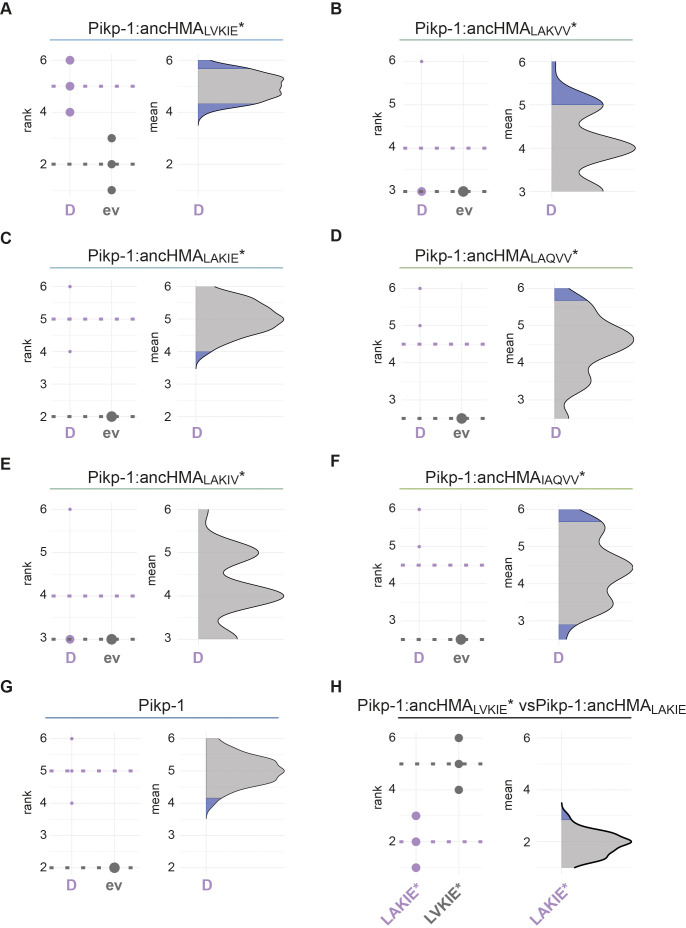
Figure 6—figure supplement 5. Statistical analysis of cell death for the Pikp-1:ancHMA mutants within the IAQVV/LVKIE region.

Figure 6—figure supplement 5.

The statistical analysis was performed using an estimation method implemented in besthr R library (MacLean, 2019). (A–G) Each panel corresponds to a different Pikp-1:ancHMA* mutant co-expressed with AVR-PikD (D) or empty vector (ev). All the constructs were co-expressed with Pikp-2. The left panels represent the ranked data (dots) and their corresponding mean (dashed line). The size of a dot centre is proportional to the number of observations with that specific value. The panels on the right show the distribution of 1000 bootstrap sample rank means, with the blue areas illustrating the 0.025 and 0.975 percentiles of the distribution. The difference is considered significant if the ranked mean for the co-expression with AVR-PikD falls within or beyond the blue percentile of the mean distribution for co-expression with the empty vector. (H) Statistical analysis by the estimation method of Pikp:ancHMALVKIE* (LVKIE*) and Pikp:ancHMALAKIE* (LAKIE*) co-expressed with AVR-PikD and Pikp-2 analysed as in (AG).
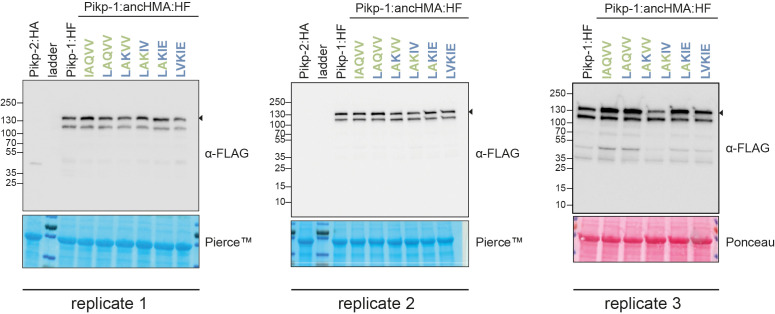
Figure 6—figure supplement 6. In planta accumulation of the Pikp-1:ancHMA* mutants in the IAQVV/LVKIE region.

Figure 6—figure supplement 6.

Western blot experiments of the Pikp-1:ancHMA* mutants (C-terminally tagged with HF) labelled above. Pikp-2 (C-terminally tagged with HA) was included as a negative control. Proteins were immunoblotted with the FLAG antisera (labelled on the right). Rubisco loading control was performed using Pierce or Ponceau staining solutions. The black arrowheads indicate expected band size. The figure shows the results from three independent experiments.