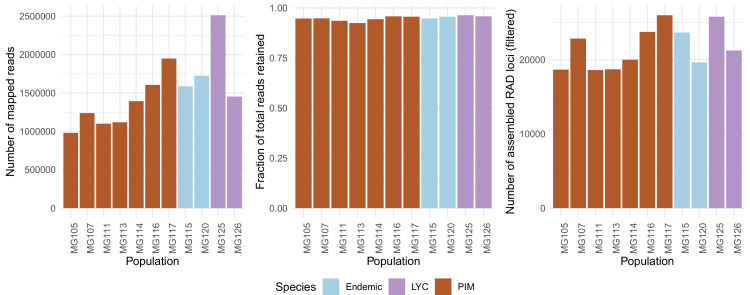
Appendix 1—figure 3. Population-specific estimates of the total number of assembled RAD loci (left panel), fractions of total reads retained after assembly (center panel), and total number of reads mapped with BWA (right panel).
The total number of mapped reads was on average lower in PIM, yet the average fractions of mapped reads assembled into loci (or ‘stacks’) and the total number of final RAD loci were roughly equal across populations and species. The differences in numbers of mapped reads point to substantial variation in total sequencing output rather than an inability to map in PIM.

