. 2021 Jun 24;10:e64165. doi: 10.7554/eLife.64165

Figure 2. Galápagos PIM is the result of a recent invasion from Ecuador.

(A) Map: average genetic distance between Galápagos PIM collections and each of the 132 mainland accessions. Plot: multi-locus principal components analysis (PCA). Squares, diamonds, and circles indicate Peruvian, Ecuadorian, and Galápagos collections, respectively. Inset: Predicted continental origins for Galápagos PIM collections. Colors are same as shown in the multi-locus PCA (Exact locations vary substantially between runs. Results from a single run are shown). (B) Maximum likelihood relationships among focal populations calculated with Treemix (allowing no migration). Left: inferred trees of 1000 resampled datasets (500 SNPs, with replacement). Right: consensus topology. All trees were rate-smoothed (λ = 1). (C) Diversity and divergence metrics. Left: nucleotide diversity (π) calculated for Galápagos PIM, Ecuador-PIM, and Peru PIM in overlapping 100 kb windows. Invariant windows (π = 0) are truncated and are instead shown in the inset bar plot. Right: average pairwise sequence divergence for three PIM comparisons: Gal×Gal, Gal×Ecu, and Gal×Peru. Each point represents a comparison between individuals, averaged over all loci.

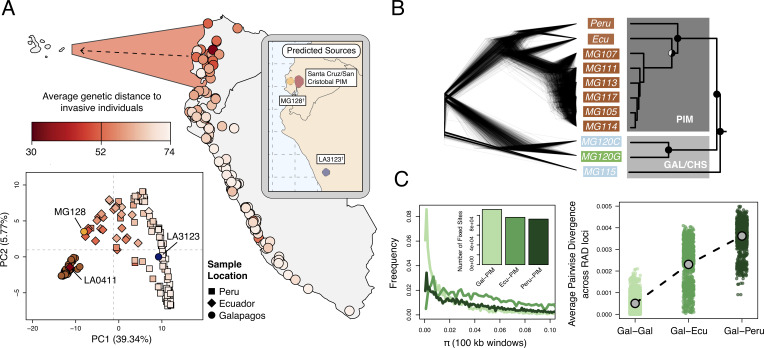
Figure 2.

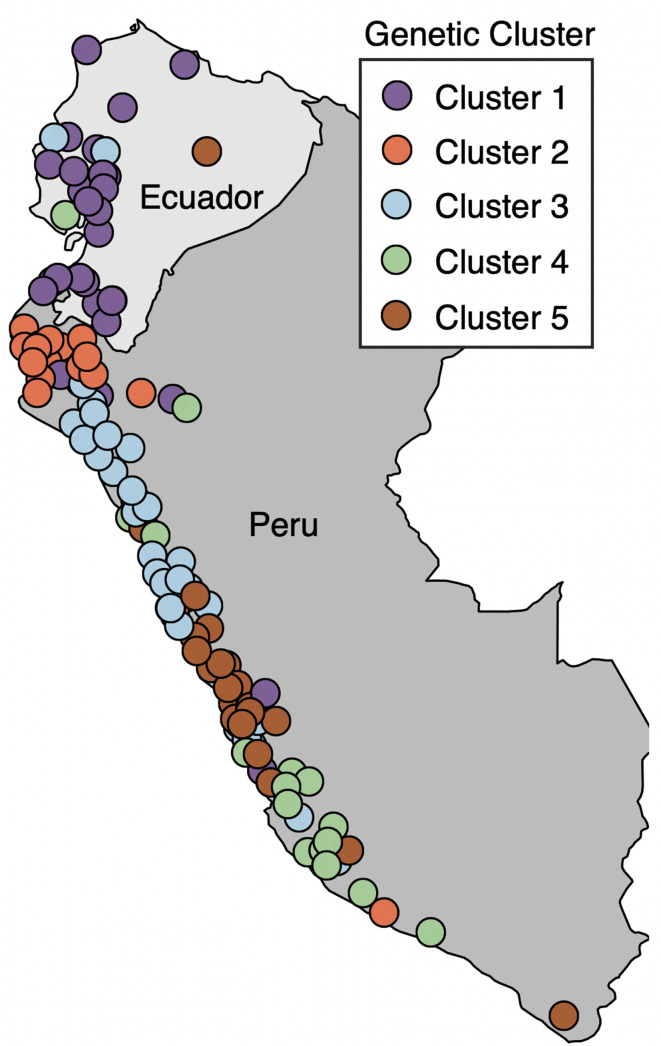
Figure 2—figure supplement 1. Map of mainland collection sites, colored by genetic ancestry cluster as determined in Gibson and Moyle, 2020.

Figure 2—figure supplement 1.

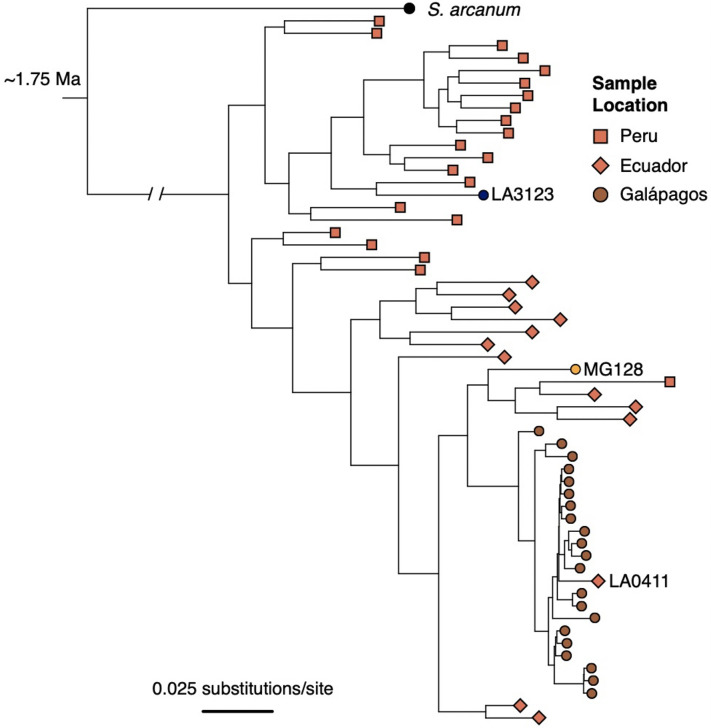
Figure 2—figure supplement 2. ML tree of individual samples inferred with RA×ML, using data concatenated across all RAD loci.

Figure 2—figure supplement 2.

Samples were subset by population (for Galápagos collections, 1–2 individuals/population) and by geographic region (for mainland accessions; 20 individuals from Peru, 14 individuals from Ecuador) to limit redundancy and increase computation speed.
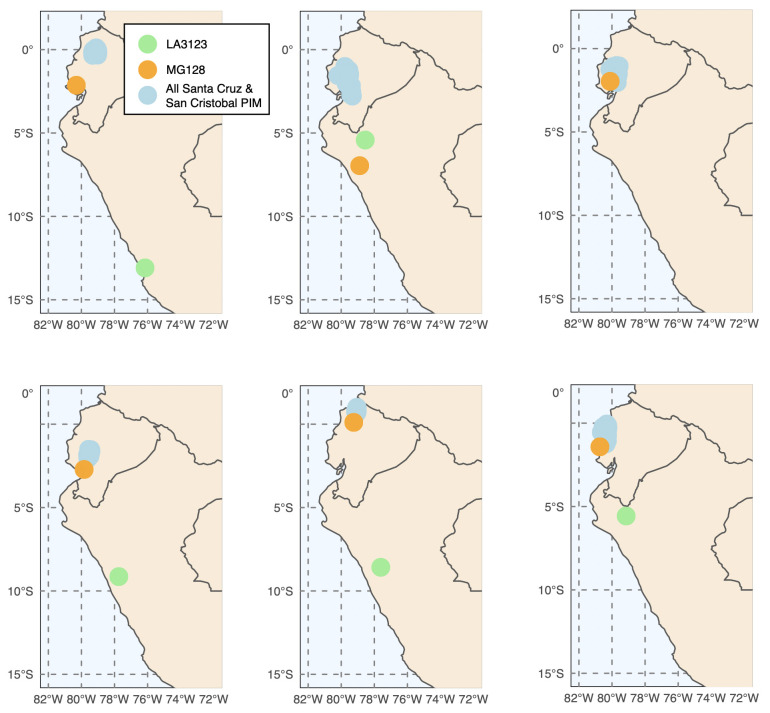
Figure 2—figure supplement 3. Six runs of Locator (Battey et al., 2020) generally support a three-invasion scenario.

Figure 2—figure supplement 3.

Exact source localities for MG128-1 and LA3123 varied substantially across run.
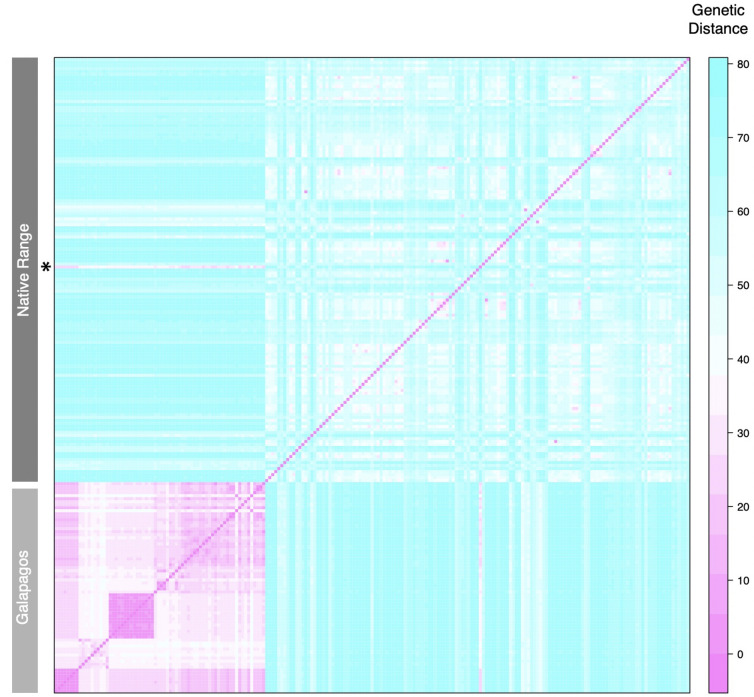
Figure 2—figure supplement 4. Pairwise genetic distances at all polymorphic loci.

Figure 2—figure supplement 4.

Row indicated with an asterisk is LA0411, a sample putatively reintroduced to mainland Ecuador from Galápagos.
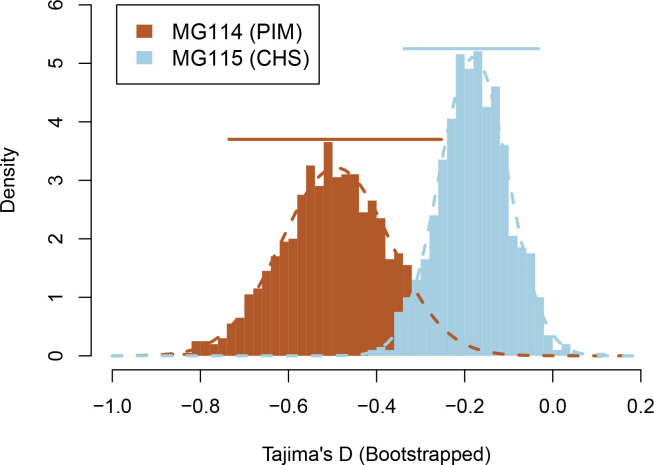
Figure 2—figure supplement 5. Bootstrapped sampling distributions of Tajima’s D for populations MG114 and MG115.

Figure 2—figure supplement 5.

Colored bars represent 95% CIs. Data were generated from 1000 bootstrap replicates of the site frequency spectrum (SFS).
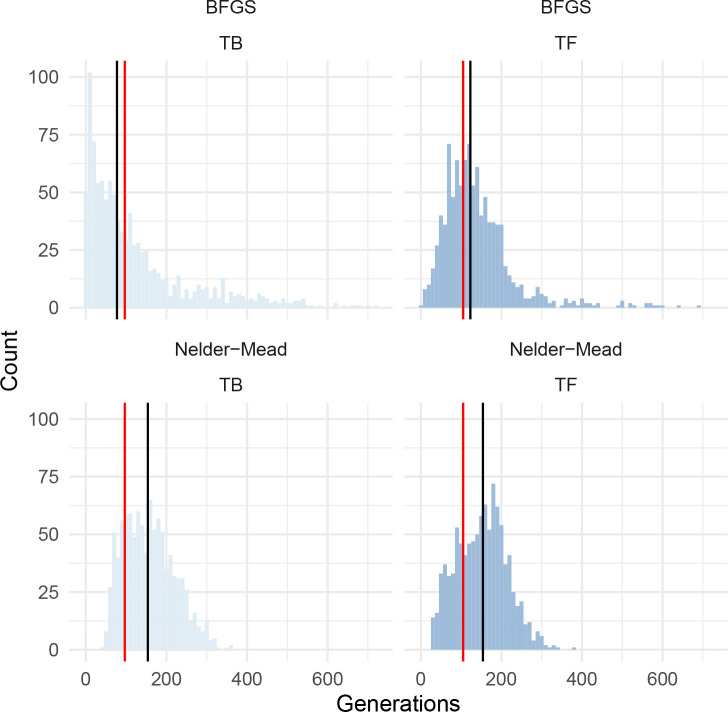
Figure 2—figure supplement 6. Histograms of bootstrapped parameter estimates from dadi for PIM population MG114, using the introgression-masked site frequency spectrum.

Figure 2—figure supplement 6.

Red bars indicate the optimum value inferred. Black bars indicate the bootstrapped median value. Results from two optimization algorithms are shown; BFGS (top panels) and Nelder-Mead (bottom panels). TB = length of bottleneck; TF = time since end of bottleneck.