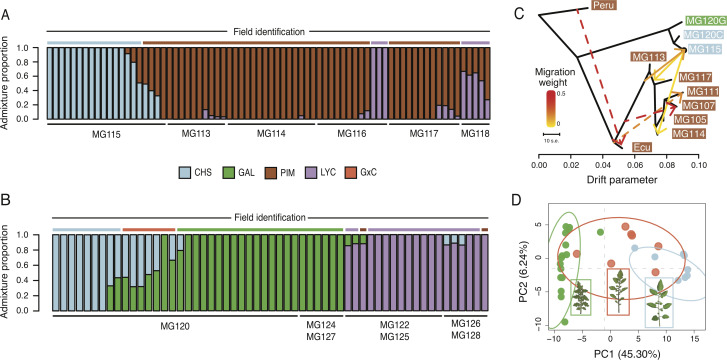
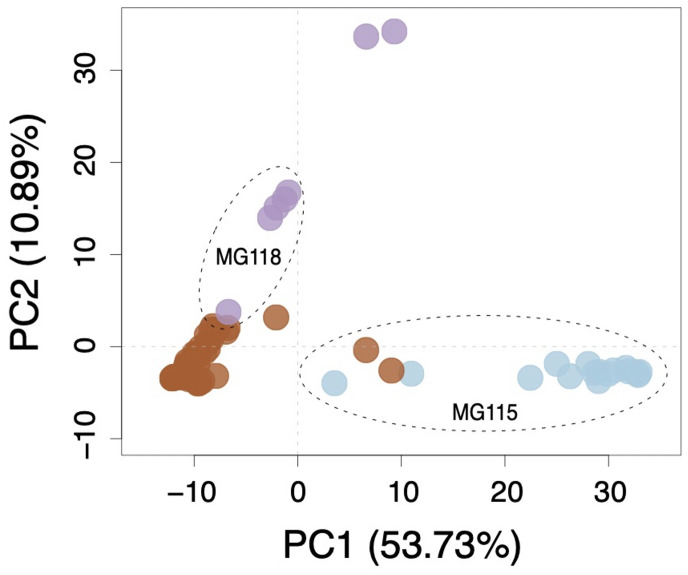
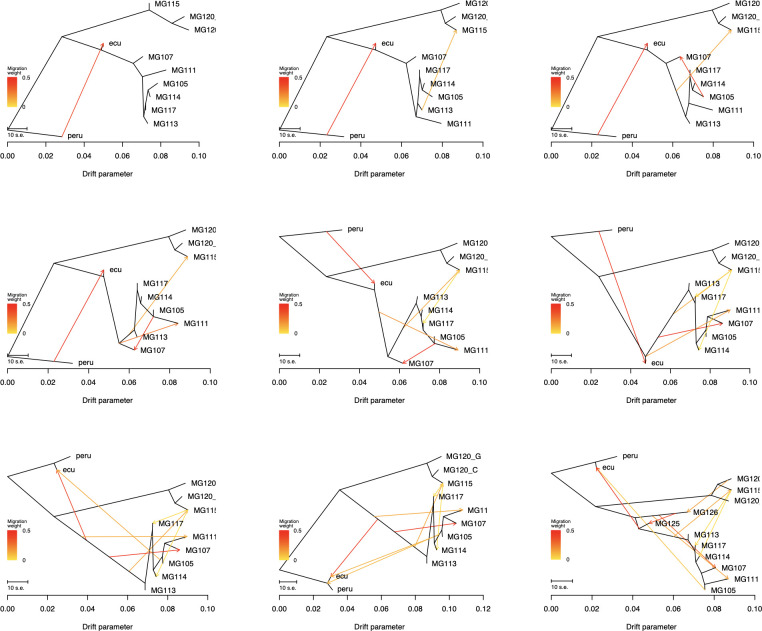
Figure 3. Patterns of population genetic structure and admixture on Santa Cruz and Isabela.
(A) fastStructure inference for all Santa Cruz samples (N = 74). K = 3. (B) fastStructure inference for all Isabela samples (N = 57). K = 3. (C) Treemix analysis summary (m = 6; ln[L]=395.08). Solid lines indicate interspecific events and dashed lines indicate intraspecific events. (D) Principal components analysis for samples at site MG120, a hybrid zone between CHS and GAL.


