. 2021 Jun 24;10:e64165. doi: 10.7554/eLife.64165

Figure 4. Local ancestry assignment using hidden Markov model (HMM) characterizes a history of endemic × invasive introgression.

(A) Patterns of diversity and divergence along chromosome 6 for an MG114 individual. The region of recent coalescence (low divergence; high diversity) with CHS is annotated in gray. This 20.2 kb block segregates at 20% in MG114. (B) Genome-wide HMM predictions for all individuals in MG114. The x-axis is ordered by chromosome and y-axis is ordered by individual. Two large CHS haplotypes segregate at high frequency on chromosomes 3 (40%) and 6 (20%). (C) Visual summary of admixture proportions from CHS into three PIM populations. (D) Summary of HMM assignment for each PIM population. Populations displaying variation in fruit color (MG114 and MG117) have more CHS ancestry than those which are fixed for the ancestral red state (MG116).

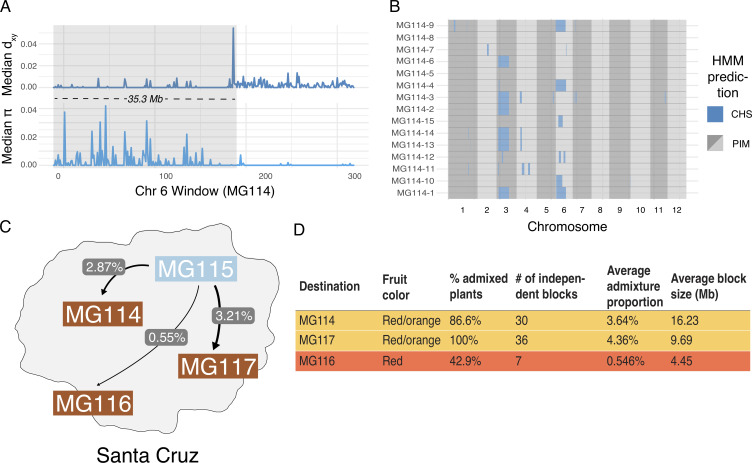
Figure 4.

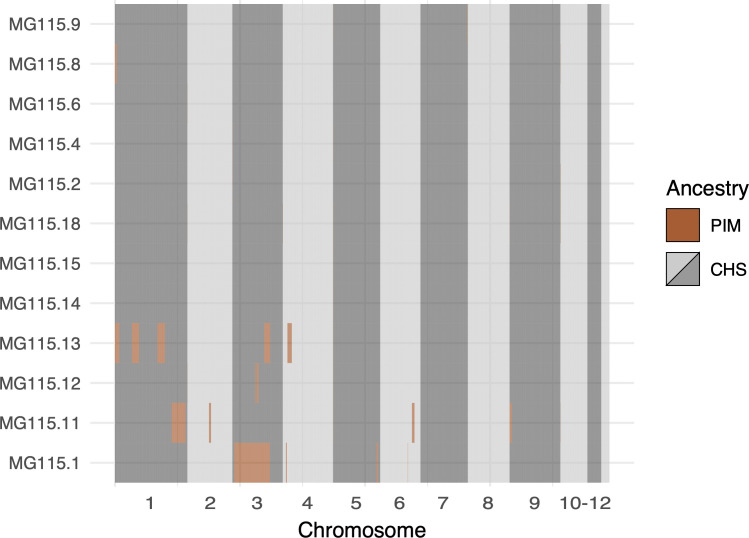
Figure 4—figure supplement 1. Local ancestry assignment throughout the genomes of CHS plants from population MG115 (Santa Cruz), using MG114 as the PIM reference population.

Figure 4—figure supplement 1.

These data represent the opposite direction of gene flow (PIM → CHS) from that shown in Figure 5B (CHS → PIM). Admixture in the PIM → CHS direction was markedly lower than CHS → PIM.
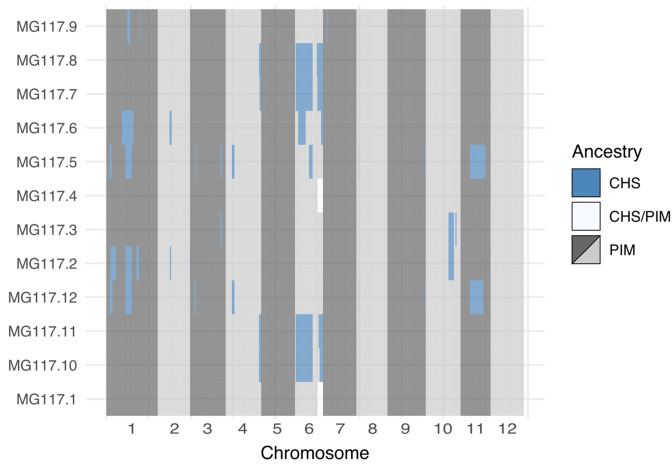
Figure 4—figure supplement 2. Genome-wide local ancestry in population MG117 as inferred by the hidden Markov model (HMM).

Figure 4—figure supplement 2.

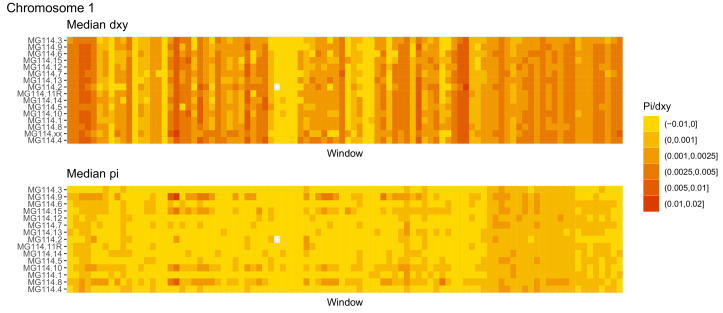
Figure 4—figure supplement 3. Diversity and divergence across the genomes of MG114 individuals (Chromosome 1).

Figure 4—figure supplement 3.

Each cell represents 1 Mb and colors correspond to median π or dXY (to CHS population MG115). Black dots show regions of CHS ancestry predicted by the hidden Markov model (HMM). HMM predictions were done in 100 kb windows. Annotations here reflect the consensus prediction of all windows within each 1 Mb cell.
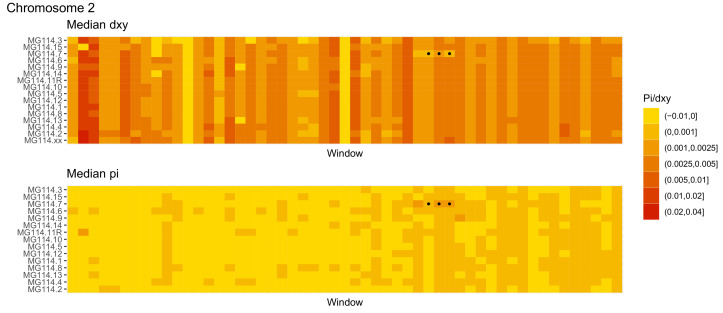
Figure 4—figure supplement 4. Diversity and divergence across the genomes of MG114 individuals (Chromosome 2).

Figure 4—figure supplement 4.

Each cell represents 1 Mb and colors correspond to median π or dXY (to CHS population MG115). Black dots show regions of CHS ancestry predicted by the hidden Markov model (HMM). HMM predictions were done in 100 kb windows. Annotations here reflect the consensus prediction of all windows within each 1 Mb cell.
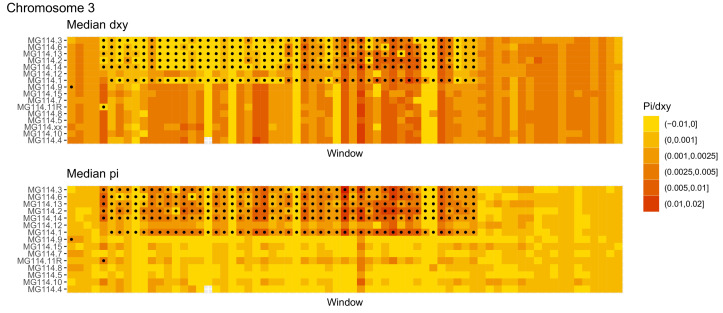
Figure 4—figure supplement 5. Diversity and divergence across the genomes of MG114 individuals (Chromosome 3).

Figure 4—figure supplement 5.

Each cell represents 1 Mb and colors correspond to median π or dXY (to CHS population MG115). Black dots show regions of CHS ancestry predicted by the hidden Markov model (HMM). HMM predictions were done in 100 kb windows. Annotations here reflect the consensus prediction of all windows within each 1 Mb cell.
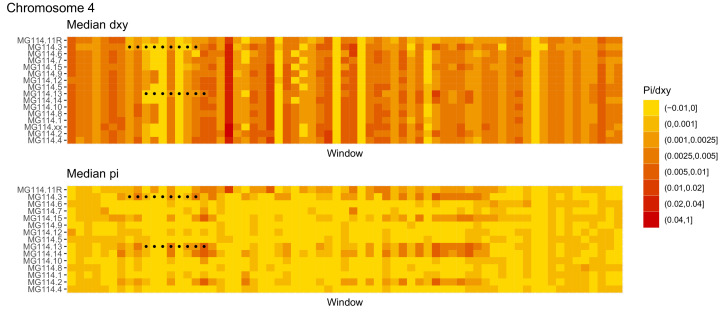
Figure 4—figure supplement 6. Diversity and divergence across the genomes of MG114 individuals (Chromosome 4).

Figure 4—figure supplement 6.

Each cell represents 1 Mb and colors correspond to median π or dXY (to CHS population MG115). Black dots show regions of CHS ancestry predicted by the hidden Markov model (HMM). HMM predictions were done in 100 kb windows. Annotations here reflect the consensus prediction of all windows within each 1 Mb cell.
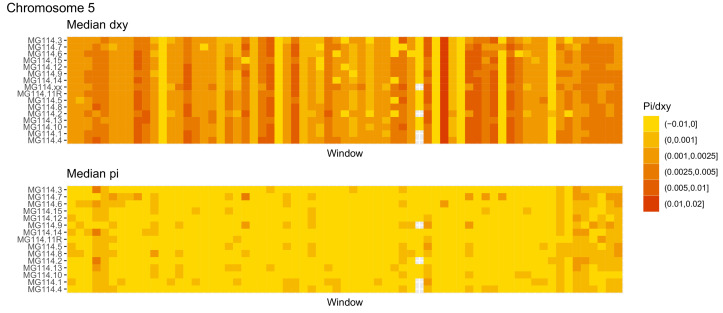
Figure 4—figure supplement 7. Diversity and divergence across the genomes of MG114 individuals (Chromosome 5).

Figure 4—figure supplement 7.

Each cell represents 1 Mb and colors correspond to median π or dXY (to CHS population MG115). Black dots show regions of CHS ancestry predicted by the hidden Markov model (HMM). HMM predictions were done in 100 kb windows. Annotations here reflect the consensus prediction of all windows within each 1 Mb cell.
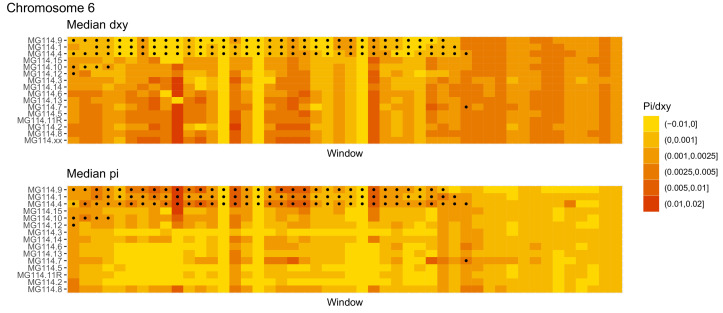
Figure 4—figure supplement 8. Diversity and divergence across the genomes of MG114 individuals (Chromosome 6).

Figure 4—figure supplement 8.

Each cell represents 1 Mb and colors correspond to median π or dXY (to CHS population MG115). Black dots show regions of CHS ancestry predicted by the hidden Markov model (HMM). HMM predictions were done in 100 kb windows. Annotations here reflect the consensus prediction of all windows within each 1 Mb cell.
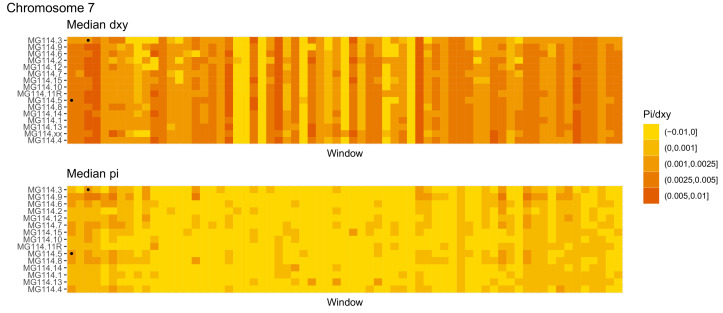
Figure 4—figure supplement 9. Diversity and divergence across the genomes of MG114 individuals (Chromosome 7).

Figure 4—figure supplement 9.

Each cell represents 1 Mb and colors correspond to median π or dXY (to CHS population MG115). Black dots show regions of CHS ancestry predicted by the hidden Markov model (HMM). HMM predictions were done in 100 kb windows. Annotations here reflect the consensus prediction of all windows within each 1 Mb cell.
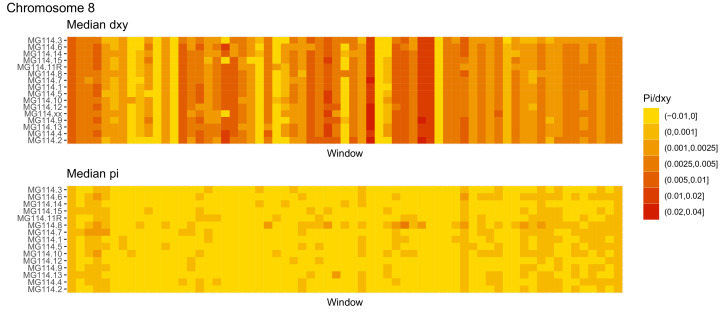
Figure 4—figure supplement 10. Diversity and divergence across the genomes of MG114 individuals (Chromosome 8).

Figure 4—figure supplement 10.

Each cell represents 1 Mb and colors correspond to median π or dXY (to CHS population MG115). Black dots show regions of CHS ancestry predicted by the hidden Markov model (HMM). HMM predictions were done in 100 kb windows. Annotations here reflect the consensus prediction of all windows within each 1 Mb cell.
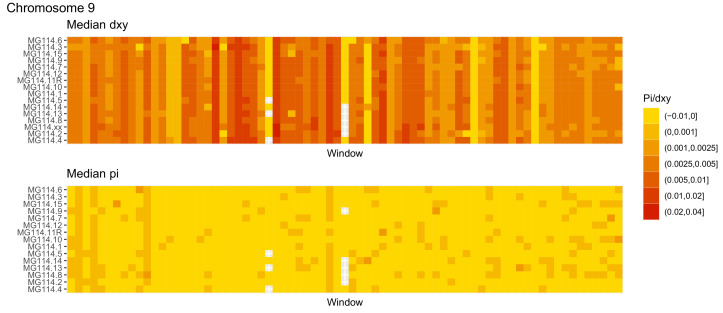
Figure 4—figure supplement 11. Diversity and divergence across the genomes of MG114 individuals (Chromosome 9).

Figure 4—figure supplement 11.

Each cell represents 1 Mb and colors correspond to median π or dXY (to CHS population MG115). Black dots show regions of CHS ancestry predicted by the hidden Markov model (HMM). HMM predictions were done in 100 kb windows. Annotations here reflect the consensus prediction of all windows within each 1 Mb cell.
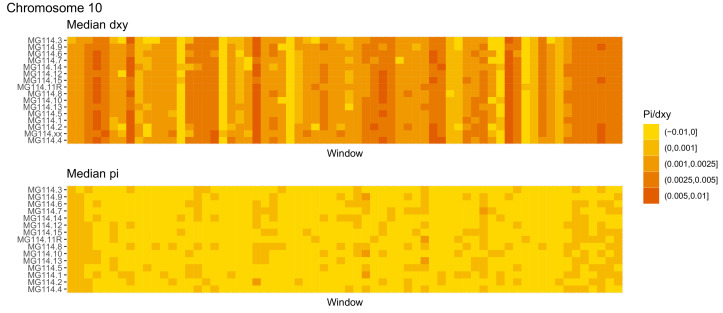
Figure 4—figure supplement 12. Diversity and divergence across the genomes of MG114 individuals (Chromosome 10).

Figure 4—figure supplement 12.

Each cell represents 1 Mb and colors correspond to median π or dXY (to CHS population MG115). Black dots show regions of CHS ancestry predicted by the hidden Markov model (HMM). HMM predictions were done in 100 kb windows. Annotations here reflect the consensus prediction of all windows within each 1 Mb cell.
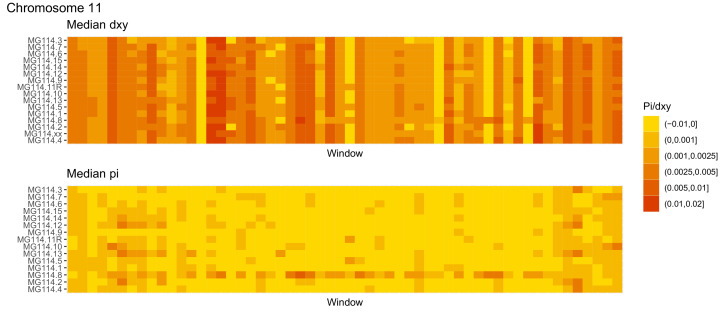
Figure 4—figure supplement 13. Diversity and divergence across the genomes of MG114 individuals (Chromosome 11).

Figure 4—figure supplement 13.

Each cell represents 1 Mb and colors correspond to median π or dXY (to CHS population MG115). Black dots show regions of CHS ancestry predicted by the hidden Markov model (HMM). HMM predictions were done in 100 kb windows. Annotations here reflect the consensus prediction of all windows within each 1 Mb cell.
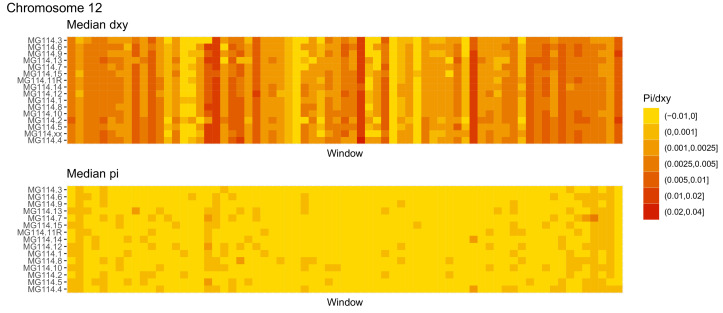
Figure 4—figure supplement 14. Diversity and divergence across the genomes of MG114 individuals (Chromosome 12).

Figure 4—figure supplement 14.

Each cell represents 1 Mb and colors correspond to median π or dXY (to CHS population MG115). Black dots show regions of CHS ancestry predicted by the hidden Markov model (HMM). HMM predictions were done in 100 kb windows. Annotations here reflect the consensus prediction of all windows within each 1 Mb cell.