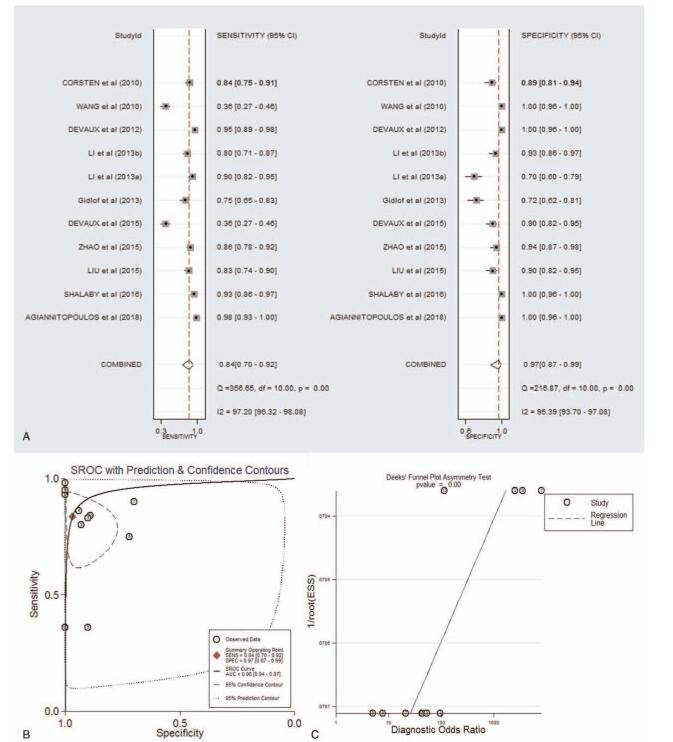
Figure 5.
The sensitivity, specificity, DOR, SROC curve with AUC, and funnel graph of miR-499 in the diagnosis of AMI. (A) Sensitivity and Specificity. (B) SROC curve with AUC. (C) Funnel graph. AMI = acute myocardial infarction; AUC = area under the curve; DOR = diagnostic odds ratio; SROC = summary receiver operator characteristic.

