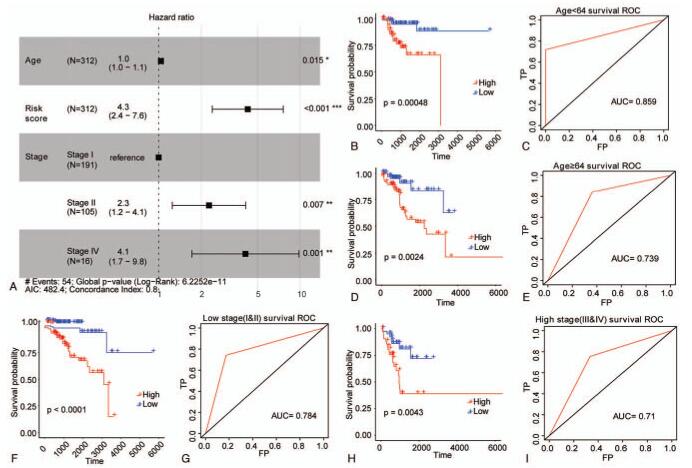
Figure 3.
Risk score was an independent prognostic signature for EC in training set. (A) The forest plot of multivariate Cox regression analysis. Samples with hazard ratio > 1 exhibited higher risk of death, and samples with hazard ratio < 1 exhibited lower risk of death. (B–E) The survival curves of EC patients with different ages were determined by Kaplan–Meier method. (F–I) The survival curves of EC patients with different TNM stages were determined by Kaplan–Meier method. The horizontal axis denotes time, the vertical axis denotes survival rate, and altered colors represent different groups. P value is computed by log-rank test.

