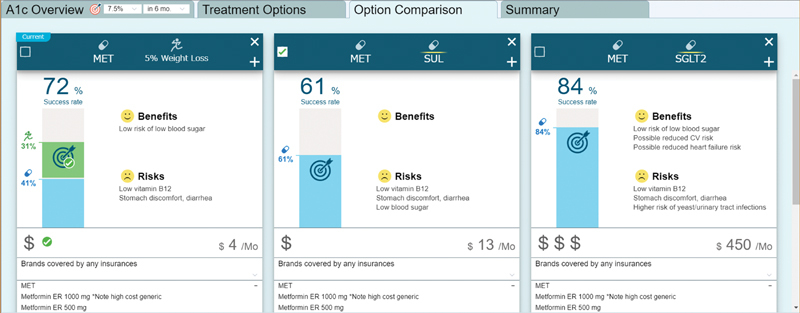
Fig. 8.

Options comparison tab in the dashboard: The clinician and patient can review potential treatment options in detail using this view. Comparative data are provided for three treatment options. The “success rate” shows the predicted probability of treatment success for each potential treatment regimen. The effect of 5% body weight loss is also shown for the current medication regimen. The predictions are specific to the current patient and are based on the various data points that have been pulled in from the EHR. Clinicians and patients can also review the benefits and risks of each medication option. In addition, cost information is provided, including the National Average Drug Acquisition Cost. The patient's insurance information is pulled in from the EHR, and coverage information specific to the patient's insurance is provided (All synthetic data). EHR, electronic health record.
