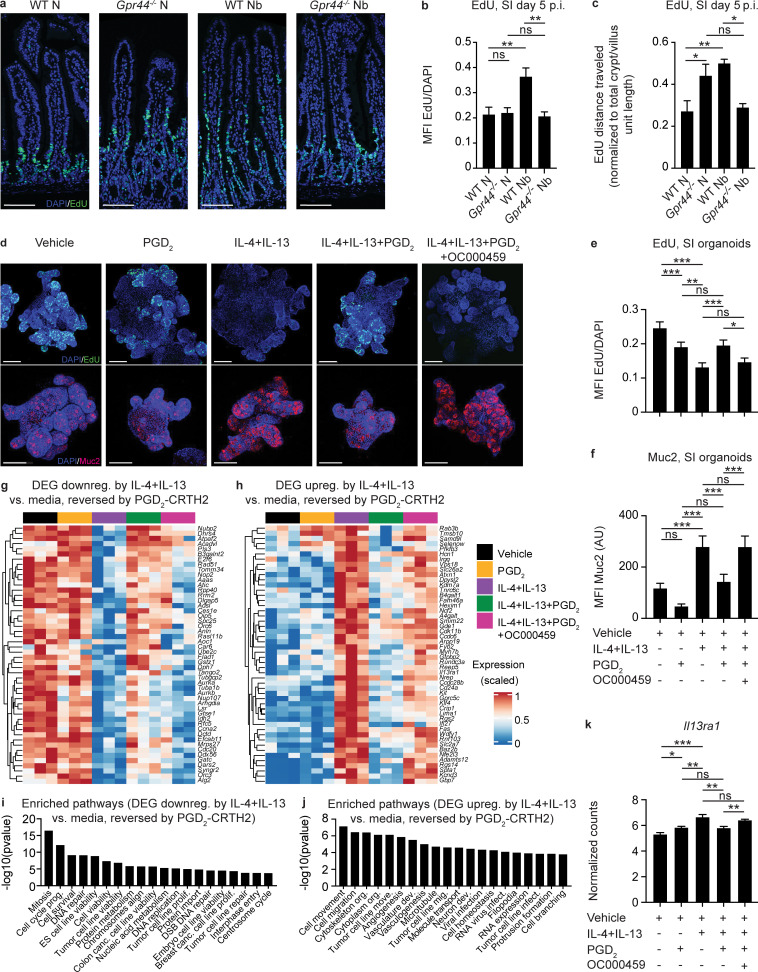
Figure 7.
The PGD2-CRTH2 pathway limits the Type 2 cytokine–induced IEC functional program.(a–c) Littermate or cohoused C57BL/6 WT and Gpr44−/− mice were infected with 500 N. brasiliensis (Nb) L3 larvae subcutaneously and treated i.p. with EdU on day 4 p.i. In naive (N) mice and mice on day 5 p.i., representative images showing immunofluorescent staining for EdU in histological sections of the small intestine (SI; a) were quantified for the ratio of the EdU (green) MFI to DAPI (blue) MFI (b) and the distance EdU+ cells had traveled in the crypt/villus unit normalized to the total crypt/villus length (c). Scale bar = 100 µm. Small intestinal organoids from C57BL/6 WT mice were cultured for 2–3 d in media or Type 2 cytokines (250 µg/ml rmIL-4 and 250 µg/ml rm IL-13) with or without 20 µM PGD2 and with or without 1 µM OC000459 (CRTH2 inhibitor). (d–f) Representative images showing immunofluorescence staining for EdU (green, upper row) or Muc2 (red, lower row) and DAPI (blue) in whole-mount organoids (d) were quantified for the EdU ratio to DAPI MFI (e) or Muc2 MFI (f). Scale bar = 100 µm. (g and h) Organoids were dissociated, sort-purified for live cells, and subjected to RNA-seq to identify DEGs that were down-regulated (downreg.; g) or up-regulated (upreg.; h) by culture with rmIL-4+rmIL-13 compared with vehicle alone and reversed when PGD2 was added, in a CRTH2-dependent manner (top 50 displayed). (i and j) IPA was used to identify functional pathways that were enriched in these DEG sets, showing the top 20 ordered by P value of those with a z-score >2.0 (up-regulated) or less than −2.0 (down-regulated). (k) Il13ra1 expression (normalized counts) in organoids from RNA-seq data. Data are mean ± SEM. (b, c, e, and f) Analyzed using a linear mixed-effects model with pairwise comparison. (k) Analyzed using a one-way ANOVA. (a–c) N, n = 4 or 5; Nb, n = 4 or 5 (5–10 crypt/villus units were examined/mouse and those values were averaged); two independent experiments. (d–f) n = 5–10 organoids/condition/experiment; four independent experiments. (g–k) n = 3 replicates/condition; one experiment. Each n refers to number of mice/group in total across all experiments unless otherwise noted. *, P ≤ 0.05; **, P ≤ 0.01, ***, P ≤ 0.001. canc., cancer; dev., development; DSB, double-stranded break; ES, embryonic stem; infect., infection; mig., migration; move., movement; org., organization; prolif., proliferation; prog., progression.

