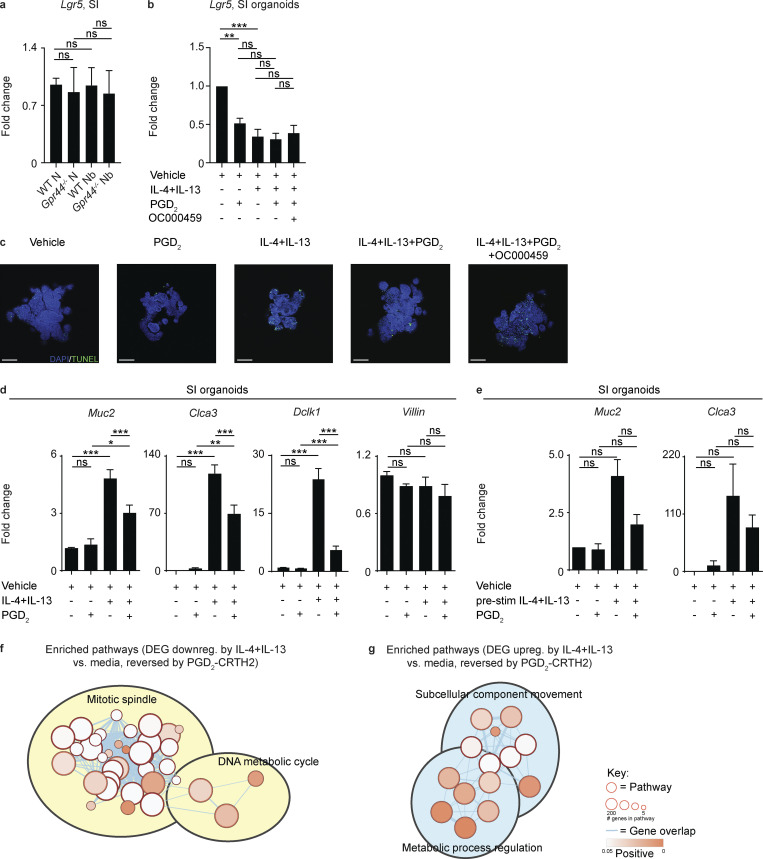
Figure S5.
Lgr5 expression in WT and Gpr44−/− mice following N. brasiliensis infection and organoid TUNEL staining and gene expression in response to Type 2 cytokines with or without engagement of the PGD2-CRTH2 pathway. (a) C57BL/6 WT and Gpr44−/− mice were infected with 500 N. brasiliensis (Nb) L3 larvae subcutaneously, and the expression of Lgr5 in small intestinal (SI) homogenates was measured by real-time PCR (relative to Actβ and normalized to WT naive [N]). Small intestinal organoids from C57BL/6 WT mice were cultured for 2 d in media or Type 2 cytokines (250 µg/ml rmIL-4 and 250 µg/ml rmIL-13) with or without 20 µM of PGD2 and with or without 1 µM OC000459. (b) Real-time PCR was used to measure expression of Lgr5 calculated relative to Gapdh. (c) Representative images showing immunofluorescence staining for TUNEL in whole-mount organoids. Scale bar = 100 µm. (d) Real-time PCR was used to measure expression of Muc2, Clca3, Dclk1, and Villin calculated relative to Gapdh. (e) Organoids were prestimulated (pre-stim) with Type 2 cytokines with or without 20 µM PGD2. Real-time PCR was used to measure expression of Muc2 and Clca3, calculated relative to Gapdh. (f and g) Enrichment map of functional pathways associated with PGD2-responsive genes that were down-regulated (downreg.; f) or up-regulated (upreg.; g) by IL-4+IL-13 treatment of organoids. Related pathways were clustered and annotated in Cytoscape. Data are mean ± SEM. (a, b, d, and e) Analyzed using a linear mixed-effects model with pairwise comparison. (a) N, n = 10–12; Nb, n = 14–19; six independent experiments. (b) Three or four experiments. (c) Two experiments. (d and e) Three to six experiments. (f and g) n = 3 replicates/condition; one experiment. Each n refers to number of mice/group in total across all experiments unless otherwise noted. *, P ≤ 0.05; **, P ≤ 0.01; ***, P ≤ 0.001.

