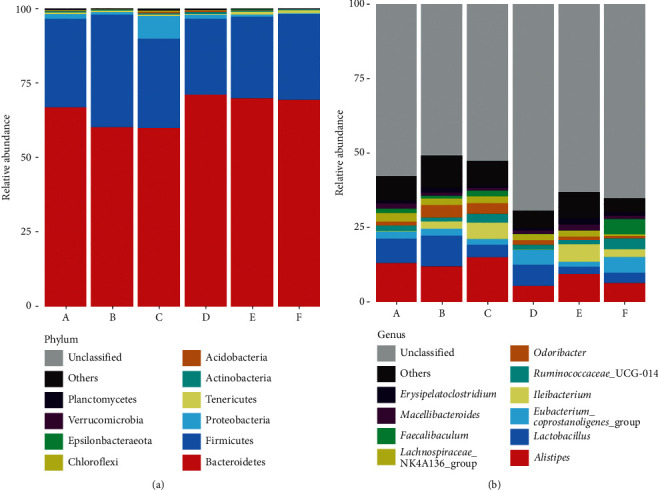
Figure 3.

The composition and relative abundance of gut microbiota in mice feces at the phylum and genera levels. (a) Phylum level classification composition and relative abundance. (b) Genera level classification composition and relative abundance. A, normal group with middle-dose aqueous Cistanche tubulosa (CT) extract added; B, normal group; C, model group; D, model group with high-dose CT aqueous extract added; E, model group with middle-dose CT aqueous extract added; F, model group with low-dose CT aqueous extract added.
