Figure 3.

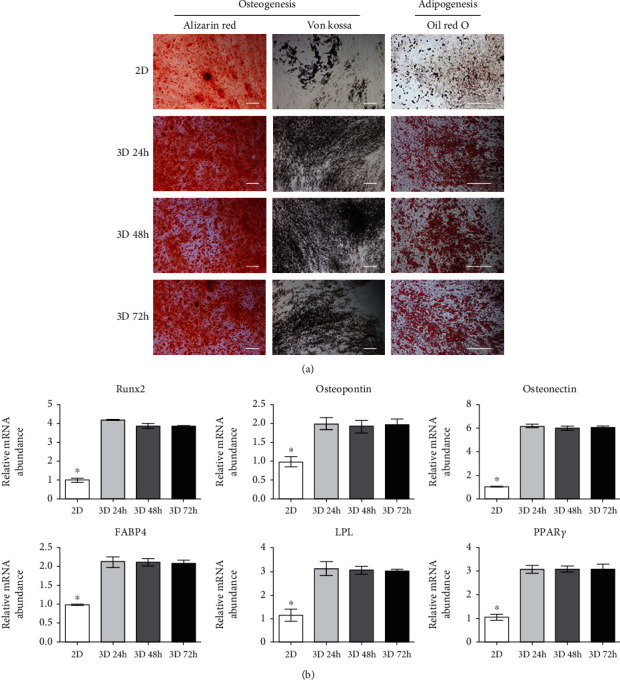
In vitro osteogenic and adipogenic differentiation capacity of DPSCs. (a) The adipocyte differentiation of DPSCs was evaluated by Oil red O staining of lipid droplets. Osteogenesis was evaluated by Alizarin red and von Kossa staining of mineralization and calcium deposition (scale bar = 200 μm). The 2D cultured DPSC group showed to be most weakly stained with Oil red O, Alizarin red, and von Kossa. (b) Expression of osteoblast- (Runx2, osteopontin, and osteonectin) and adipocyte- (FABP4, LPL, and PPARγ) specific genes in induced 2D and 3D cultured DPSC groups. All osteogenesis- and adipogenesis-specific markers were significantly increased in induced 3D cultured DPSC groups as compared to 2D cultured DPSCs. However, no difference was confirmed among the 24-hour 3D cultured (3D 24 h), 48-hour 3D cultured (3D 48 h), and 72-hour 3D cultured (3D 72 h) cells. YWHAZ was used as an internal control. Asterisk (∗) represents a significant (p < 0.05) difference.
