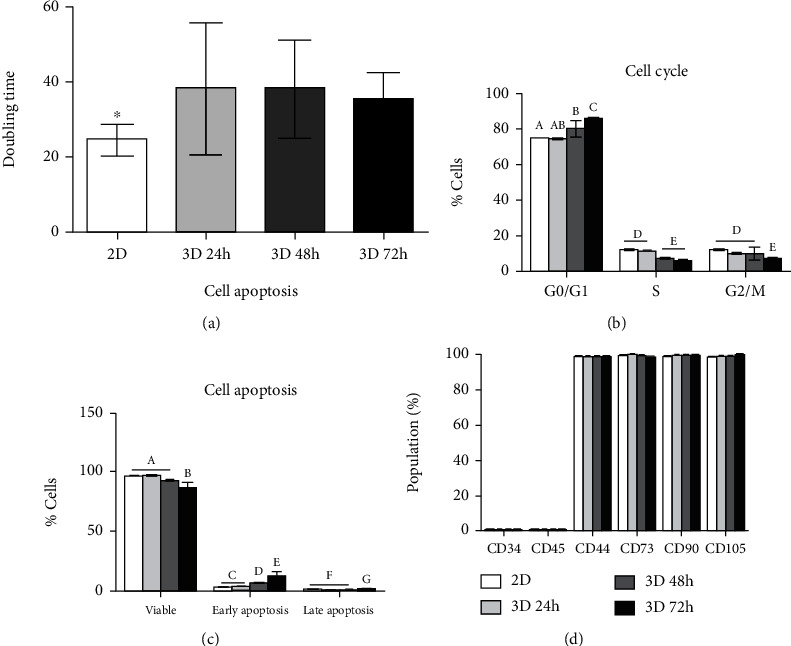
Figure 4.

The characteristics of 2D and 3D cultured DPSCs with the time course of the 3D culture. (a) Analysis of cell proliferation by population doubling time (PDT). The 3D cultured DPSCs revealed decreased proliferation capacity as compared to 2D cultured DPSCs. Asterisk (∗) represents a significant (p < 0.05) difference. (b) Cell cycle analysis showed that cell arrest was increased and DNA replication was increased in 3D cultured DPSCs (p < 0.05). (c) Similarly, cellular apoptosis was also increased, and the portion of the viable cell was decreased in 3D cultured DPSCs with the time course. (d) There was no difference in the CD marker profiling among the 2D and 3D cultured DPSCs. Different superscripts (a to g) represent a significant (p < 0.05) difference.
