Figure 7.

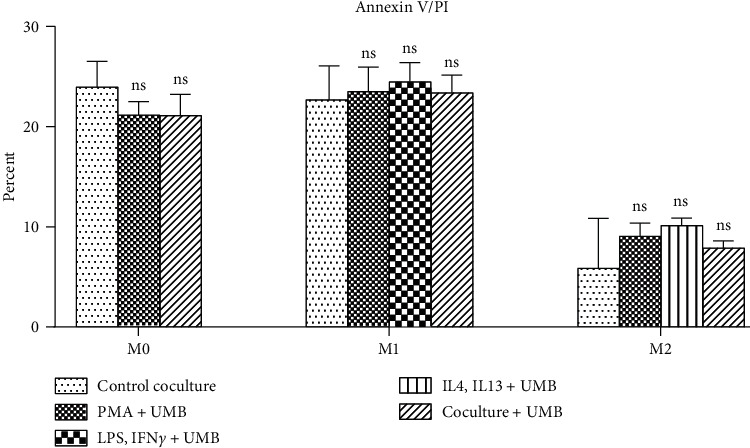
Annexin V/PI assay of AGS cells cocultured with UMB 10 μM treated M0, M1, and M2 cells. Each bar represents the mean ± SD of the three independent experiments. ∗P < 0.05; ∗∗P < 0.01; ∗∗∗P < 0.001; ∗∗∗∗P < 0.0001; ns: not significant.

Annexin V/PI assay of AGS cells cocultured with UMB 10 μM treated M0, M1, and M2 cells. Each bar represents the mean ± SD of the three independent experiments. ∗P < 0.05; ∗∗P < 0.01; ∗∗∗P < 0.001; ∗∗∗∗P < 0.0001; ns: not significant.