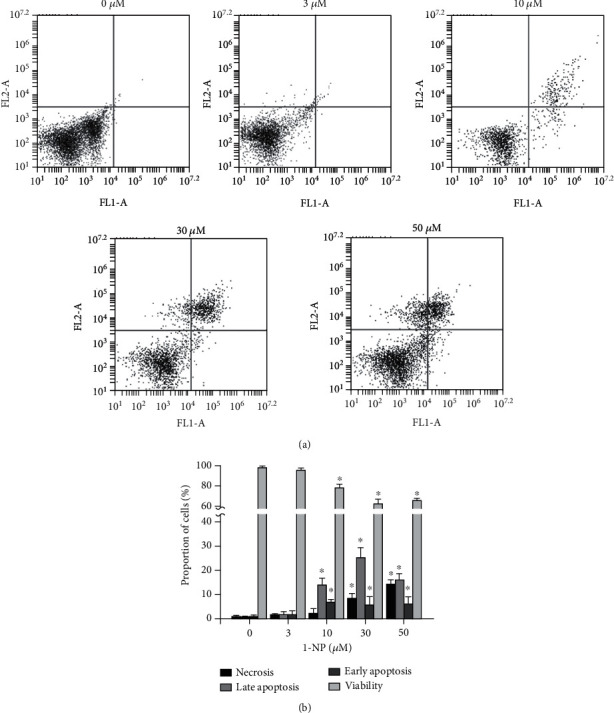
Figure 2.

1-NP induced apoptosis and necrosis in RAW264.7 macrophages. The portion of apoptosis and necrosis was measured by Annexin V-FITC and PI assays using flow cytometry. (a) Cells were incubated with 1-NP at concentrations of 0, 3, 10, 30, and 50 μM for 24 h at 37°C. The upper left quadrant (Annexin V−/+) is representative of necrosis; the upper right and lower right quadrants (Annexin V+/PI+ and Annexin V+/PI−) are representatives of apoptosis; and the lower left quadrant (Annexin V−/PI−) is representative of living cells. (b) Quantitatively, the percentage of necrotic cells, viable cells, and apoptotic cells was calculated and analyzed. Data are expressed as mean ± SD (n = 5). ∗P < 0.05 was considered significant compared with the control group.
