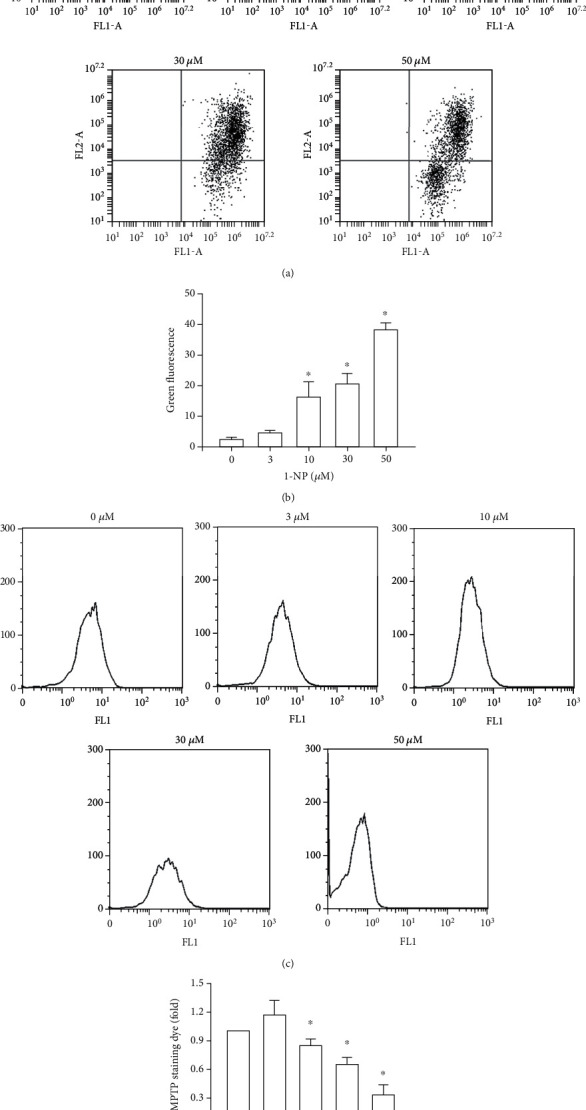
Figure 3.

1-NP induced mitochondria dysfunction in RAW264.7 macrophages. The portion of mitochondria dysfunction was measured by JC-1 assays using flow cytometry. (a) After cell treatment, the portion of MMP was measured using the JC-1 assay. (b) Quantitatively, the percentage of MMP downregulation cells was calculated and analyzed. The MPTP opening was measured by flow cytometry. (c) After cell treatment, the histogram of MPTP opening was measured using the MPTP assay kit. (d) The change in fold of MPTP opening cells between the treated and control groups was calculated. Data are expressed as mean ± SD (n = 5). ∗P < 0.05 was considered significant compared with the control group.
