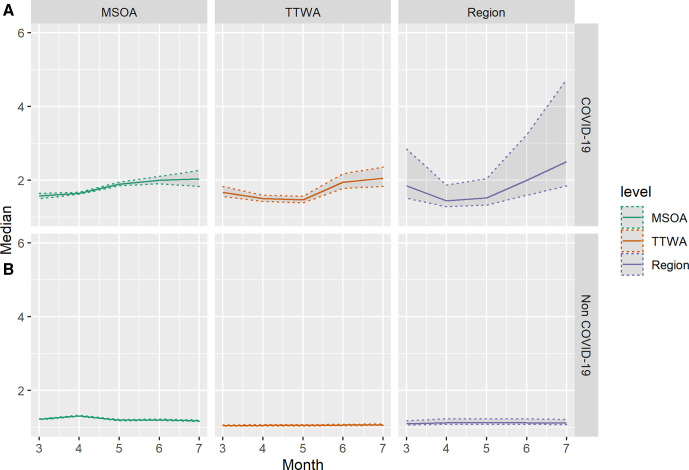
Figure 2.
Estimates of median COVID-19 (A) and non-COVID-19 (B) median mortality rate ratio across three administrative scales, by month from March to July 2020. Shaded areas indicate 2.5th and 97.5th percentile credible intervals of posterior parameter distributions. MSOA, Middle-Layer Super Output Area; TTWA, Travel to Work Area.

