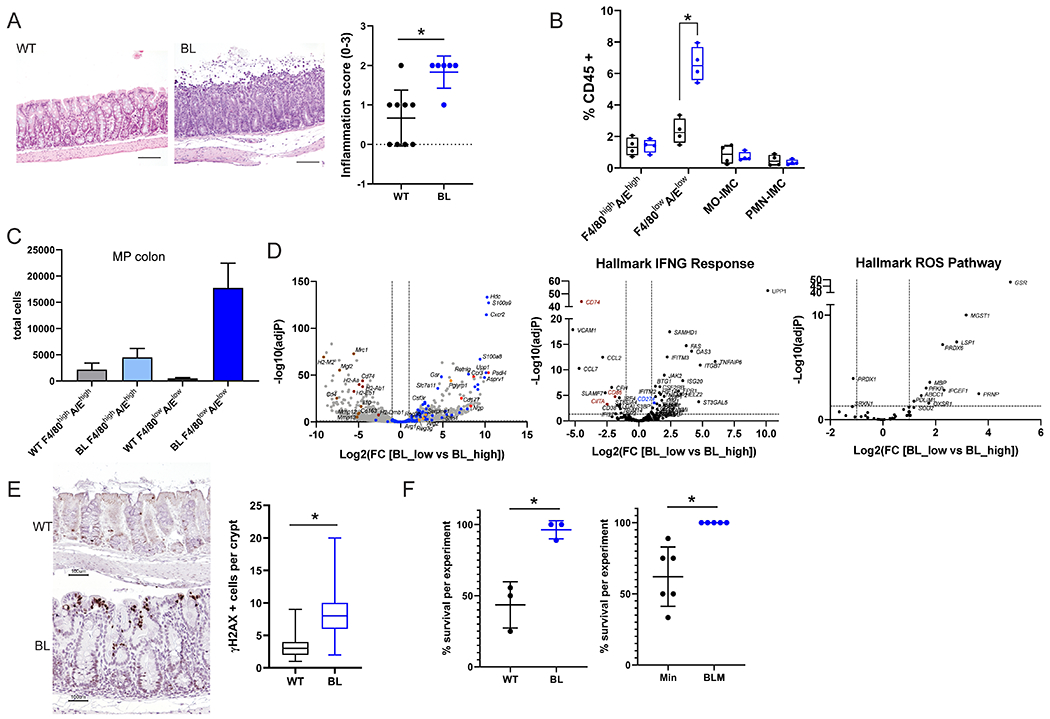
Figure 1. Inflammation and myeloid cells with a PMN-MDSC signature are increased in the mid-proximal colon of BRAFV600E relative to wild-type mice after ETBF colonization.

A) Representative H&E images of mid-proximal colon regions of WT and BL mice 7 days after ETBF colonization. Scale bar = 100 μM. Inflammation scores for the mid-proximal colon region in WT (N=9) and BL (N=6) for 2 experiments. B) FACS analysis of myeloid cells (F4/80highI-A/Ehigh cells; F4/80lowI-A/Elow cells; Mo, monocytes; PMN, polymorphonuclear cells; IMC, immature myeloid cells) from mid-proximal colon tissues 7 days post ETBF. C) Total number of F4/80highI-A/Ehigh and F4/80lowI-A/Elow cells sorted from the mid-proximal colon regions of WT and BL mice (N=3 each) 2 weeks post ETBF inoculation. D) Volcano plots of DESeq2 comparison of sorted F4/80lowI-A/Elow (low) and F4/80highI-A/Ehigh (high) cells isolated from BL mid-proximal in C. Dashed lines indicate cut-offs used for significantly differentially expressed genes (adjP < 0.01 and log2-fold change > 2). Left, genes from MDSC gene set (49); center, hallmark INFγ Response genes; and right, hallmark ROS pathway genes. Gene highlight colors: blue, MDSC; red, neutrophil-associated; orange, antibacterial enzymes and peptides; and brown, MHC-II associated. E) Representative γ H2AX IHC in the mid-proximal colons of mice 7 days after ETBF colonization. The number of γ H2AX positive cells per crypt that contain at least one positive cell were counted. N > 47 crypts for each genotype. Scale bar = 100 μM. F) Percent survival within 10 days of ETBF colonization for WT and BL (left, 3 experiments; total WT N=21, BL N=18 mice) and Min and BLM (right, 6 experiments; total Min N=39, BLM N=32 mice).* P < 0.05 by Fisher’s exact test. In A and F data is presented as mean +/− SD; for B and C box limits are set at the third and first quartile range with the central line at the median. *P <0.05 values for A-C were calculated by Mann-Whitney U test. Black, WT and blue, BL for all graphs. Additional information on distal colon in Supplementary Figure 1.
