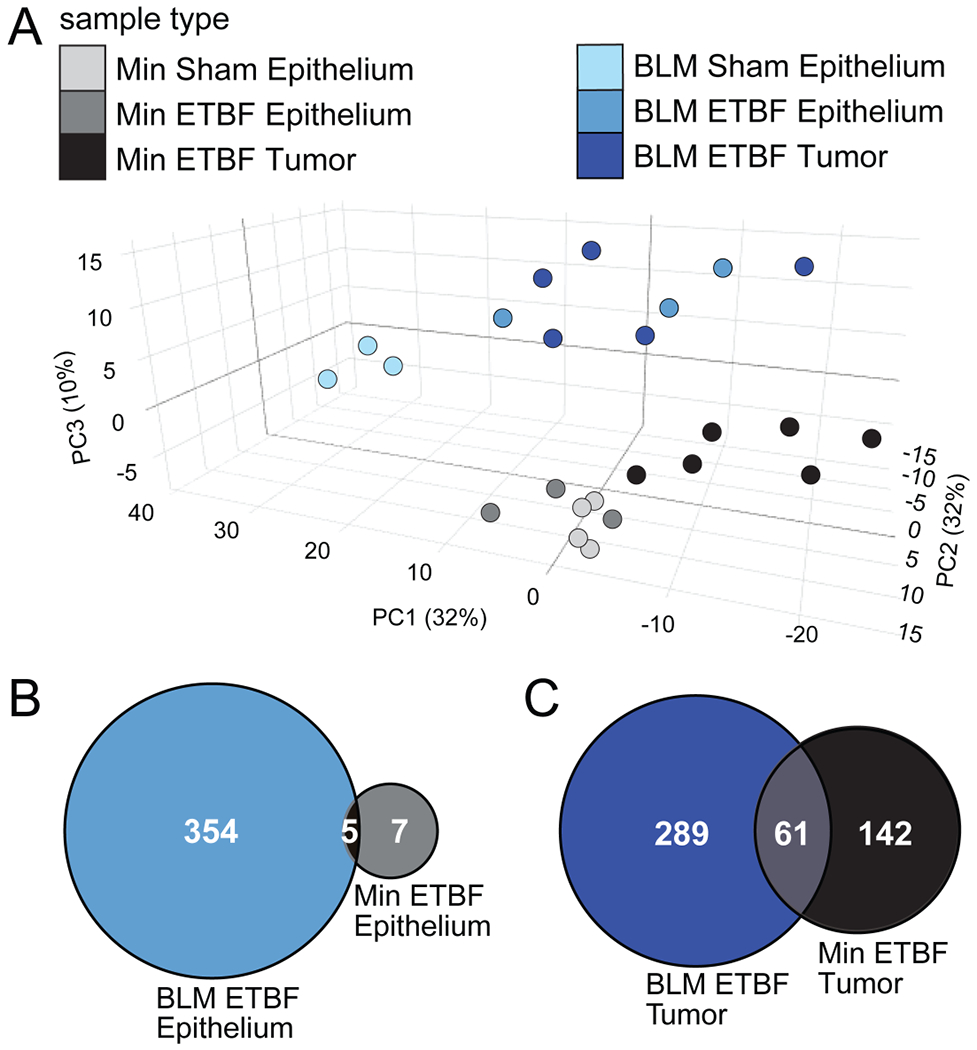
Figure 3. The addition of BRAFV600E results in distinct ETBF colonization-associated CpG island DNA hypermethylation.

A) Principal component (PC) analysis of MBD-seq z-scores of the 747 regions in CpG islands with DNA hypermethylation in at least one of the tumor groups relative to sham epithelium. Epithelia (N=3-4) and tumor (N=5-6) samples were collected from distal and mid-proximal regions of Min and BLM colons, respectively, 9-13 weeks post inoculation. X, Y and Z axes show PC1, PC2, and PC3 that explain 32, 32 and 10% of the total variance, respectively. Proportional Venn diagrams of the number of overlapping regions with significant DNA hypermethylation in B) ETBF-colonized epithelia or C) ETBF-induced tumors relative to their respective sham epitheliums.
